 Workflows
 Forms
Forms Data Sets
 Pages
Pages Process AI
 Automations
 Analytics
 Apps
Apps Integrations
 Property management
 Human resources
 Customer management
 Information technology


 Customer health index is a crucial metric to look at.
Why?
The customer’s Net Promoter Score (NPS) was in the highest percentile, yet I found myself closing the account. How did we miss this churning customer? Were there early warning signs we’d failed to notice?
I used to work as a technical customer service representative for an environmental testing laboratory. It was my job to keep an eye on the accounts I handled. I needed to make sure the customers were happy and meeting their goals with us. For this, we relied heavily on NPS scoring, but this measure was failing us.
NPS scoring could be failing you, too.
The problem is that NPS metrics give reactive, snapshot values. Plus there are other aspects to an account’s health beyond customer satisfaction. For instance, you need to understand your customer’s goals and whether they’re on track to meeting those goals.
According to McKinsey and Company, perfecting account health scoring can improve client retention by up to 95%. If I knew this, I could have prevented that one account from churning.
In this Process Street article, we introduce a more comprehensive and proactive means of determining the health of your accounts: the customer health index (CHI).
- What is a customer health index?
- Why you should transition from NPS to CHI
- How to calculate a customer health index in 4 steps
What is a customer health index?
A customer health index gives an overall view of an account’s health. The CHI is a framework used to identify the status of your customers. Accounts are classified to be in either:
- Good health
- Average health
- Poor health
From here, you can address which account needs attention, why, and the proper course of action.
For a better understanding, imagine CHI is the doctor for your accounts. When you go to your doctor for a checkup, they will take several different measurements to determine your health. Let’s say your cholesterol is of concern with a value of 200. Because doctors use a lot of data to determine that value, they can dig deeper into this figure and decipher its severity (i.e., if your good cholesterol score is 100, then the high cholesterol measure doesn’t look too bad).
The above highlights the beauty of having a robust model. With a lot of data sources, you can make the right decisions when looking at your accounts.
Your CHI needs to:
- Use a combination of several KPIs, metrics, and other data sources. Afterall, CHI is an index to help you understand the overall health of your accounts.
- Represent the complexity of your customer base in a simplified manner.
- Be credible. For instance, if 50% of your accounts are deemed healthy, but 20% are churning, your model is neither accurate nor credible.
- Indicate the reasons for any recorded changes to an account’s health (i.e., give reasons why the numbers are what they are).
- Utilize automation to collect data in real-time that reflects the customer’s health status.
Why you should transition from NPS to CHI
As a concept, CHI aligns CS operations to better serve your customer’s needs. The full customer lifecycle is considered to give an objective, normalized measure of an account’s health. We’re talking about taking measures from the moment a customer is aware of your business to the moment they renew or upgrade your service or product.
Business today is a lot different from what it was in the 90s. Everything is online, and that means your customers are, too. This has altered the customer’s lifecycle – from how they make their purchase decisions to their expectations of you as a business. As consumers, we’re fickle folk; and if we see a better option, we’ll switch to your competitor.
Researching and analyzing competitor options is easier today than it ever has been. Think about it; if you want to find the best pair of running shoes, you boot up your computer and Google it. The information you need to make an informed decision is right at your fingertips.
For business, this means the competition became stiffer. It’s no longer enough to compete on product features. You need to provide the best experience to prevent your customers from ever wanting to leave. This is customer success 2.0, and CHI is the tool to help you do that.
If we compare CHI metrics to NPS scores, you understand why NPS is an outdated and unreliable measure. NPS was developed in 2003 and uses a single question to determine the health of an account: “How likely are you to recommend us to others?”
This question doesn’t build a clear customer profile and predict customer needs. In contrast, CHI gives a proactive, 360-degree view of a customer’s health throughout their journey with you. As a result, shortfalls in customer satisfaction are continuously identified.
The unique benefits of using a customer health index
The CHI framework offers a more integrated measure of client experience, which can boost retention rates to above 95%.
Other benefits of CHI are as follows. CHI…
- Is customer-centric by taking into account multiple metric measures and the customer’s complete lifecycle.
- Gives a multi-dimensional view of the customer’s experience and the health of an account for a more thorough course of action.
- Takes a scientific approach using facts and data to develop targeted actions that’ll improve an account’s health.
- Produces quantitative diagnostics and proven recipes for success. This empowers senior leaders to measure and achieve the account health needed for sustained long-term performance.
- Aligns performance across different organizational departments, functions, teams, geographies, and tenure levels to share a common set of goals and priorities.
- According to McKinsey and Company, appropriate measures of an account’s health can explain up to 50% performance variation within companies. This helps leaders analyze the impact of company practices and culture on performance, and creates an implementation roadmap to improve it.
- Brings a deep understanding of business and industry. Experts can work side-by-side with senior leaders from the world’s top organizations to turn analysis into a lasting business impact.
If you’re using dimensional measures (e.g., NPS) to determine the health of your accounts, it’s time to move away. You need CHI to drive change and keep customers for life.
How to calculate a customer health index in 4 steps
Your customer health index needs to incorporate different functions and data points across your business. Your aim is to gain an overall view of your customer’s health, from the start of their lifecycle until the end. Below, we give you the steps needed to do this.
Step #1: Break down your customers lifecycle into separate steps
For an overview of your account’s health, you need to understand your customer’s lifecycle. A customer lifecycle details how your customers interact with you at different points in their journey.
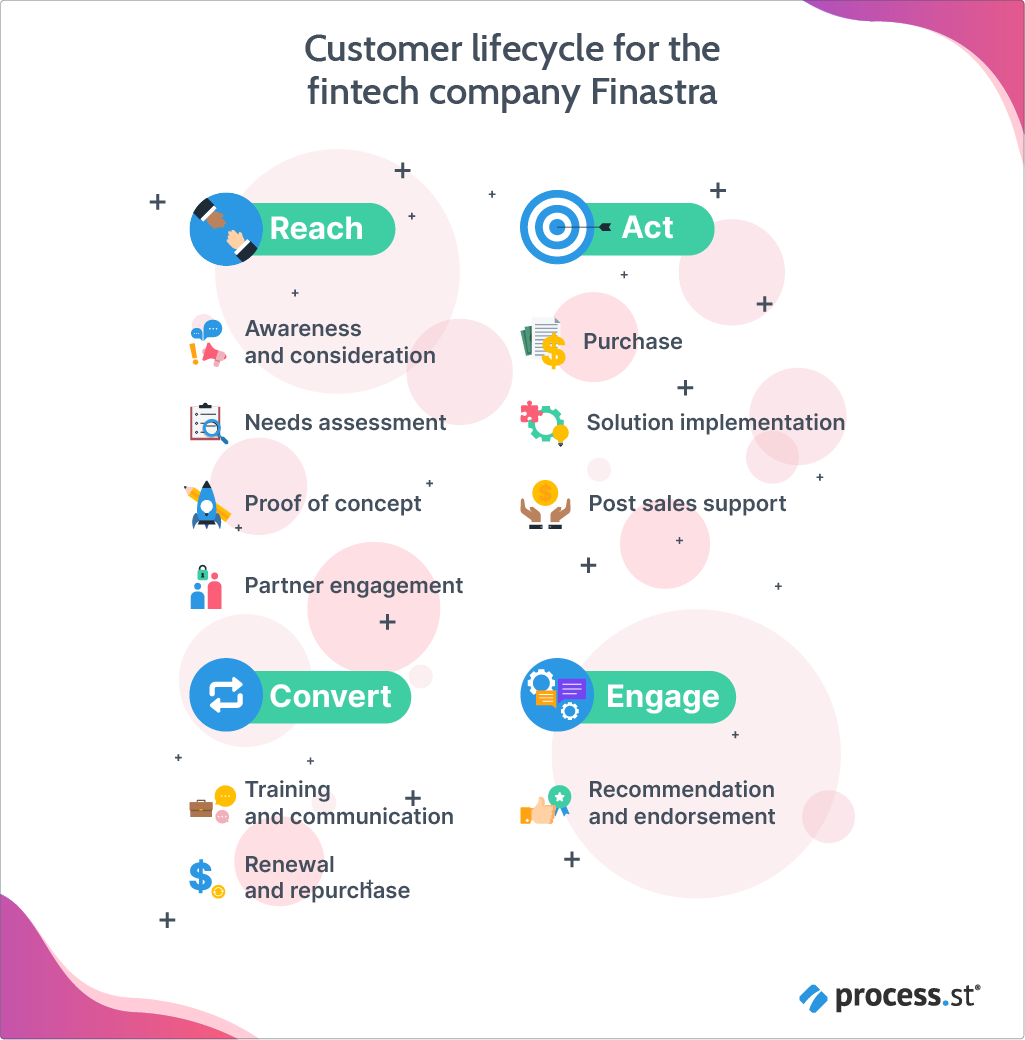
To illustrate this, let’s look at a real-life example. Below is the customer lifecycle used by one of the largest fintech companies in the world, Finastra:
- Stage #1 – Awareness and consideration: Awareness happens when the buyer is experiencing problems or the symptoms of pain, and their goal is to alleviate it. Consideration occurs when the buyer has defined their problem and is committed to researching the available options to solve it.
- Stage #2 – Needs assessment: A needs assessment is the systematic process of determining and addressing needs, or gaps, between current conditions and desired conditions (wants). The discrepancy between the current condition (where the prospect is at) and the wanted condition (where the prospect wants to be) must be measured to appropriately identify the need.
- Stage #3 – Proof of concept: Proof of concept is about validating the feasibility and usefulness of your product/service for your prospect.
- Stage #4 – Partner engagement: Partner engagement determines how involved the prospect is with your brand. To deepen this involvement, there needs to be trust and knowledge exchanged over time.
- Stage #5 – Purchase: This is crunch time when the consumers make their final decision. Providing the help your customers need is critical at this point. 53% of consumers will abandon a purchase if they can’t find a quick answer to their question.
- Stage #6 – Solution implementation: It’s not enough for your customers to purchase your product or service, you want them to become weekly or daily active users to prove solution implementation. This is especially important in SaaS where products/services are sold on a subscription basis.
- Stage #7 – Post-sales support: Post-sales support means customers continue to derive value from your offering. As prospects implement your product they’ll have questions. It’s your job to provide personalized support to galvanize the relationship you have with them.
- Stage #8 – Training and communication: Communicate with your prospects to understand their evolving needs. Showcase further use-cases and provide learning opportunities that display product/service value.
- Stage #9 – Renewal and repurchase: Customer churn can obliterate your business when left unchecked. If you shift your focus away from marketing in the final stages, and favor customer care and product advocacy, you’ll keep your renewal rates high.
- Stage #10 – Recommendation and endorsement: For healthy accounts, you’ll want them to give a positive and truthful opinion about you. Recommendations and endorsements are an important part of your brand image, and an essential focus towards the end of a customer’s lifecycle.
This is Finastra’s customer lifecycle. Note that the specifities of your customers lifecycle will be different.
Step #2: Define a minimum of 3 KPIs for each separate step in your customer lifecycle
To determine your CHI, you need KPI metrics that give an accurate representation of your customer’s health. Coming back to our Finastra example, let’s take a peek at some of the relevant KPIs they could use for each lifecycle stage.
Stage #1 – Awareness and consideration
KPIs include:
- Average time on webpage;
- Company size;
- Number of open discussions/product enquiries.
Stage #2 – Needs assessment
KPIs include:
- The number of C/D level meetings;
- Number of free trial or paid plan signup;
- Potential contract value.
You get the picture.
You’ll need to select the most appropriate KPIs for each stage of your customer’s lifecycle. Make sure you consider your client’s perspective to determine what KPIs to use. This gives a customer-oriented focus to build a clear profile and a stronger gauge of satisfaction.
Step #3: Build a system that collects KPI data feeds from business functions in real-time
Your best bet to obtaining KPI data in real-time is to employ the help of customer-success tools/applications. Different tools/applications will collect different data points from each stage of your customer’s lifecycle.
Going in-depth about what tools/applications to use, for when, and why, is beyond the scope of this article. Keep an eye for upcoming articles in this space.
For instance, you could be using Google analytics to track user behavior on your website – e.g., the number of qualified prospects that sign up for your free trial.
Then you’ll move into your CRM. Here you’ll collect KPI metrics that come later in the customer’s lifecycle, such as the number of support tickets.
What you need is a way of centralizing this information. Otherwise, calculations can get messy with metric measures stored in different tools/applications. It’s a good idea to create monthly reports that collate vital metrics. This is why you need Process Street.
You see, every organization is a product of its processes. And it’s your business processes that connect the activities of your sales, marketing, customer success, (+ more) departments to form a complete unit. This unit is striving towards the same end goal: to keep your customers happy.
Documenting your business operations in Process Street gives clear transparency of who and which department is working on what CS-related task and when. Then, you can utilize Process Street’s features to collate your KPI metrics – each taken from the different points in a customer’s lifecycle – into a single workflow. From this workflow, you can export data as a CSV file to produce KPI reports.
Important workflow features to consider include:
- Automations and Integrations: You can connect your documented processes in Process Street with other CS tools you’re using throughout your customer’s lifecycle. This way, you can pass KPI metrics from one tool into Process Street, and then from another tool into Process Street, and so forth. KPI data for your customers is centralized in one location: your Process Street workflow. Next, use our Tasks Permissions feature to control who has access to the relevant information (this information can be accessed from anywhere in the cloud).
- Approvals: Part of delivering excellent customer experiences means breaking down organizational silos. With Process Street’s Approvals feature, you can bring members from different departments into a given Process Street workflow, to review and approve (or reject) tasks.
- Form Fields: Use Process Street’s Form Fields to collect the information you chose for each stage of the customer’s lifecycle. Coming back to the Integrations/Automations feature, you can set up Integrations that automatically populate KPI metrics into a workflow’s Form Field.
For more information on how to set up integrations from one app to another with Process Street, watch the below video.
Step #4: Normalize and weigh your KPIs to score accounts on a scale of 0-100
If you read my previous post How to Have a Customer Health Score Beyond Just NPS (Which We Know 46% of You Use!), then you’ll understand that calculating health scores doesn’t stop once you’ve gathered the different KPI metrics.
You need to assign weights to each metric measure that’s indicative of how well they determine an account’s health.
Let me explain further.
For instance, feature use could give you a sort of indication as to whether your customer is receiving value from your offering. Yet, calculating active time using the product gives a more accurate assessment. A customer may be using one feature only, but extracting the required value from that feature. That is, the account’s healthy despite the fact they aren’t using a diverse feature set. Your CHI needs to reflect this.
Assigning weights to your different KPI metrics demands an element of trial and error. To make it easier, your best bet is to dedicate weights to each stage of the customer lifecycle – e.g., KPIs used for an account’s reach lifecycle stages could be weighted at 5%. This means raw KPI measures from this stage are multiplied by 0.5 to give a net score.
Customers in the later convert lifecycle stages are assigned a higher weight to reflect the influence of these stages on an account’s overall health – e.g., Step 7 of Finastra’s CS lifecycle, post-sales support, is given a 20% weight. Multiply the raw KPI metric measures by 0.2 to give a net score.
Note that assigned weight percentages must add up to 100.
Next, add the net values together across the customer’s lifecycle to obtain an overall net account health score. Multiply this figure by 100 to map your health scores on a 0-100 scale. A summary of this calculation is given below:
[(Raw KPI metric value) x (% stage weight)/100] x 100
Using a 0-100 scale makes it easy to bucket your customers into categories red, yellow, and blue.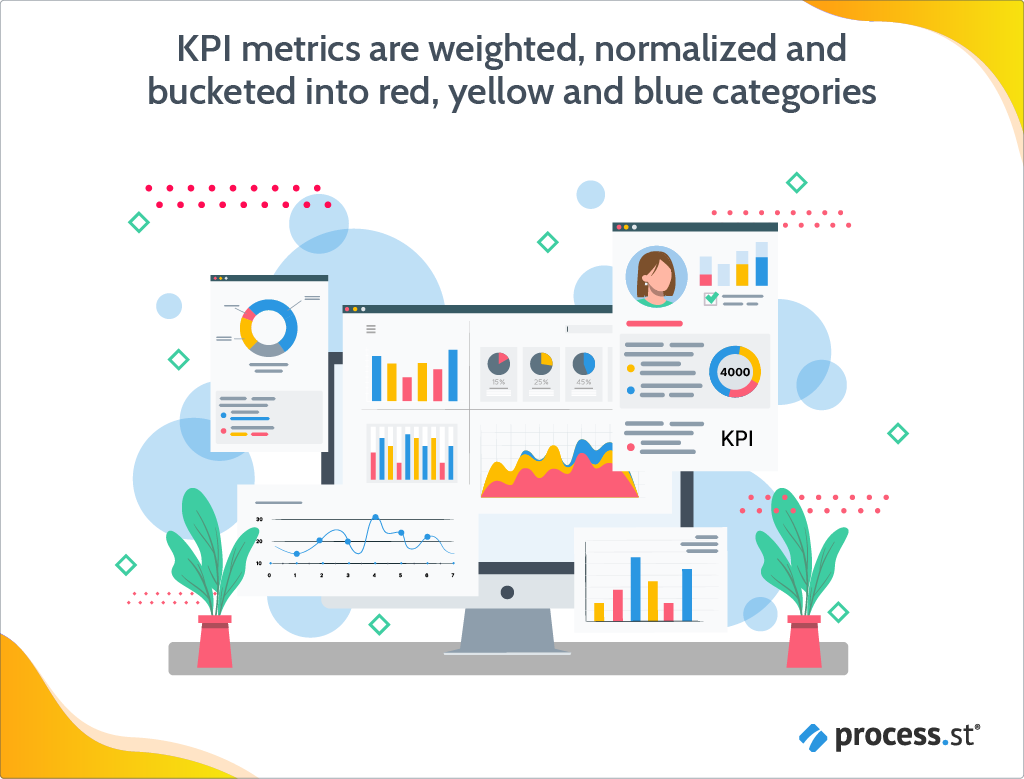 It’s good to use a color-coded system for each health score bucket. This makes account health scoring a simple process that’s easily understood by whoever is using the system. For instance, if an account remains in a red bucket then you know it’s in bad shape.
As the KPIs for each account are documented in a Process Street workflow, you can refer back to the workflow to see why their CHI score is what it is. You need to think about what KPI metrics a customer fails on. It may be that the account is in the early stages of the CS lifecycle. If this is the case, you want to focus your efforts on prospect engagement to move the account through the lifecycle as quickly as possible.
You can set up an Integration to push CHI data from the Process Street workflow into an excel file (click here to find our more). Alternatively, you could use Process Street’s Saved Views feature. With either method, you’ll be able to visualize CHI values across your entire customer base.
Customer health index: A modernized framework to secure lifelong customers
The truth is, NPS is dead.
Basing account health on a single question is narrow and inaccurate. It doesn’t acknowledge the full picture and loses pace with an increasingly digitized world.
Consumers have seemingly endless choices when it comes to finding the service/product that’s right for them. Plus, access to information to make this choice is readily available online.
To survive, modern businesses need a modern framework to better predict the needs of their customers, putting the customer at the center of the choices they make. This means measuring an account’s health throughout the customer’s lifecycle, gauging from multiple KPI metrics at each stage to produce a final CHI.
In the end, CHI will deliver lifetime customers and lifelong loyalty.
How do you measure the health of your accounts? What KPI metrics do you use? Do you use CHI, and if you do, what challenges and successes have you faced? We’d love to hear from you, please comment below!
Jane Courtnell
Hi there, I am a Junior Content Writer at Process Street. I graduated in Biology, specializing in Environmental Science at Imperial College London. During my degree, I developed an enthusiasm for writing to communicate environmental issues. I continued my studies at Imperial College's Business School, and with this, my writing progressed looking at sustainability in a business sense. When I am not writing I enjoy being in the mountains, running and rock climbing. Follow me at @JaneCourtnell.