Stock falls 8% or more below its original market price
4
Stock Price Upward Trend:
5
Stock climbs 20% to 25% above its purchase price
6
Stock Price Warning Signs:
7
New price highs on low trading volume
8
Market price falls below 50-day moving average line
9
Heavy-volume sell-off
10
Excessive trading
11
Stock Price Climax Run Signs:
12
Prolonged trading period
13
Price upswing
14
Largest price margin
15
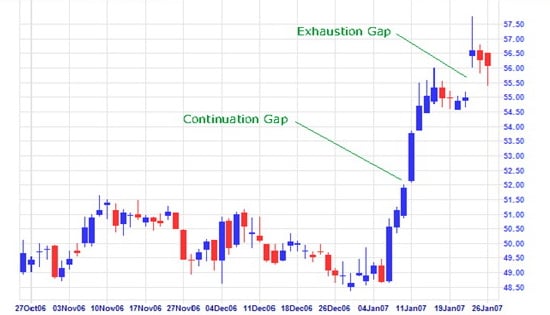
Price exhaustion gap
16
Largest price spread
Make a record of the stock in question
First off, it's a good idea to make a note of the stock in question, as this will allow you to look back on the sale and judge with hindsight of the success in doing so. Record the details using the form fields below.
Stock Price Downward Trend:
Stock falls 8% or more below its original market price
Sell a stock if it falls 8% or more below its original market price.
Stock Price Upward Trend:
Stock climbs 20% to 25% above its purchase price
Consider selling a stock if it climbs 20% to 25% above your purchase price. This could also be a tell-tale sign of an approaching bull market, when average stock market prices are generally on the downward trend, considering that the benchmark for determining a bull market is roughly a rise of 20% in the stock price.
Exception: Hold a stock for at least 8 weeks if it goes up 20% or more within three weeks after its price breakout.
Stock Price Warning Signs:
New price highs on low trading volume
If the stock market price shoots up to a new higher level even though demand-supply are at relatively low level, treat it as a warning sign.
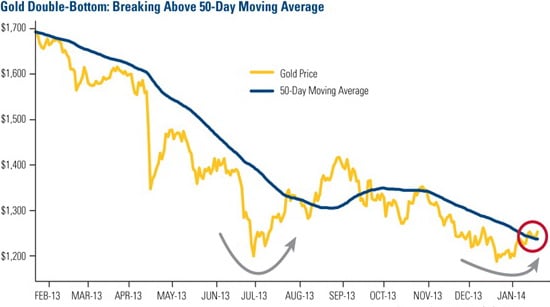
Market price falls below 50-day moving average line
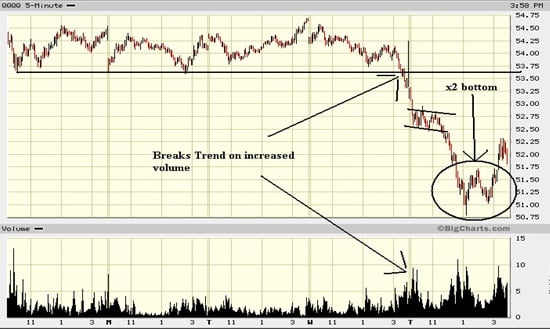
Simply put, this is when average stock market price plummets drastically to a lower level even though trading volume is at an all-time high in recent months.
Heavy-volume sell-off
Heavy volume of stocks are sold at highly reduced prices as the particular stock underwent a dramatic price drop in one single trading day.
Excessive trading
Unusually large volume of trading of stocks in a single trading day even though stock prices are practically not undergoing any noticeable price changes.
Stock Price Climax Run Signs:
A climax run also signals a stock is approaching its peak. Here are some signs a stock is undergoing a climax run:
Occurs after a long price run up of 18 weeks or more.
25% to 50% price jump in three weeks or less.
Largest one-day price gain of its entire trading period. Daily volume may also be the heaviest of its advance.
May experience an exhaustion gap, as its price opens significantly higher than the prior day's close of trading.
Weekly price spread is the largest since the stock began its trading activity.
Prolonged trading period
This situation refers to unusually prolonged trading period of a particular stock with a steady price upswing or downswing with daily gains or losses oftentimes lasting upward of 18 weeks or more.
Price upswing
Essentially, if it exhibits a 25% to 50% price jump in three weeks or less.
This could be a tell-tale sign of an approaching bear market, when stock prices are on the downtrend, considering that the benchmark for determining a bear market is roughly a 20% fall in the average stock market price.
Largest price margin
Largest one-day price gain of its entire trading period. Daily volume may also be the heaviest of its advance.
Price exhaustion gap
May experience an exhaustion gap, as its price opens significantly higher than the prior day's close of trading.
Largest price spread
Weekly price spread is the largest since the stock beganits trading activity.