






Average revenue per daily active user, or ARPDAU, tells you how much revenue each active user generates on an average day. For mobile apps and games, it is one of the fastest ways to see whether ads, in-app purchases, subscriptions, sponsorships, and other monetization choices are working.
ARPDAU is useful because it connects revenue to actual daily engagement. Total revenue may rise simply because an app has more users, but ARPDAU shows whether the value generated by each active user is improving. Used alongside retention, conversion, and ARPU, it gives product and growth teams a practical view of monetization health.
This guide covers:
- The app metrics that give ARPDAU context
- What ARPDAU means and how to calculate it
- How ARPU differs from ARPDAU
- When to use each metric
- How to improve ARPDAU and ARPU
- How Process Street supports a repeatable experimentation process
App metrics and why they matter
App metrics are standards of measurement used to track an application’s performance and guide decisions. A single number rarely explains the whole story. Revenue, engagement, retention, acquisition efficiency, and product quality interact, so teams need a small set of metrics that can be read together.
Common mobile app metrics include:
- Daily active users (DAU): the number of unique users who complete a meaningful action during a day.
- Monthly active users (MAU): unique users who are active during a month.
- Retention: the share of users who return after a defined period.
- Churn: the share of users or customers who stop using or paying for the product.
- Stickiness: often expressed as DAU divided by MAU, indicating how frequently monthly users return.
- Customer acquisition cost: the average amount spent to acquire a customer.
- Lifetime value: the revenue or gross profit expected from a customer over the relationship.
- Average revenue per user (ARPU): revenue per defined user during a stated period.
- Average revenue per paying user (ARPPU): revenue per user who actually pays during a stated period.
- Return on investment: the return produced relative to the money invested.
Braze’s mobile app metrics guide provides formulas for many of these measures. Process Street also has practical guides to customer retention, churn rate, and business metrics.
The important step is to define every metric consistently. Decide what counts as an active user, which revenue sources are included, the time zone that closes the reporting day, and how refunds, taxes, platform fees, and ad-network adjustments are handled. Without those definitions, two dashboards can show different ARPDAU values for the same app.
App metrics are key performance indicators that tell you what is working and what is not. Using a variety of different app metrics gives a refined, detailed picture of exactly how an application is doing. To cover every metric in depth would be beyond the scope of one guide, but the measures should work together. Retention rates and churn reveal whether an app keeps its audience. Daily active users, monthly active users, and daily sessions describe engagement. Acquisition cost, lifetime value, return on investment, ARPU, and ARPPU connect that activity to commercial performance.
The above-listed app metrics also help teams identify the areas of an application that need attention. A falling retention rate may point to activation or product-quality problems. Rising acquisition costs may require a channel review. A change in daily sessions per daily active user can show a shift in usage intensity. ARPDAU then adds a daily monetization view, allowing product, analytics, and growth teams to see whether the active audience is generating sustainable revenue.
Understanding ARPDAU, its calculation, and its importance
ARPDAU stands for average revenue per daily active user. It measures the average revenue generated by each active user during one day. Revenue may come from in-app purchases, subscriptions, paid upgrades, rewarded ads, display ads, sponsorships, or another monetization stream included in your reporting definition.
You can think of ARPDAU as an app tip jar. A user opens the app, engages with the experience, and may respond to a monetization opportunity. The app totals those daily payments and attributed earnings, then spreads that revenue across all active users, including the people who did not pay directly.
The formula is:
ARPDAU = revenue generated in one day / daily active users

If an app generates $1,200 in a day and records 6,000 daily active users, its ARPDAU is $0.20. The arithmetic is straightforward. The harder part is making the numerator and denominator trustworthy. If revenue is reported in UTC but DAU closes in local time, or if one report counts app opens while another counts a completed activity, comparisons will be misleading.
ARPDAU is not the same as average revenue per payer. It includes every qualifying active user in the denominator, not only users who bought something. That makes it sensitive to both monetization and engagement. A successful acquisition campaign may bring in many new active users who have not yet converted, causing total revenue to rise while ARPDAU falls. That is not automatically bad, but it is a signal worth investigating.
The definition of active also matters. A simple app open may be enough for one product, while another may require the user to complete a level, send a message, play a track, or perform another meaningful action. Choose an event that represents real engagement and keep the definition stable. Unity’s explanation of ARPDAU likewise frames the metric around revenue generated by daily active users.
Include only revenue that belongs to the same reporting window. For purchases, that may be transaction revenue recognized during the day. For advertising, networks can report estimated and finalized revenue on different schedules. Teams should document whether they use estimated daily revenue, finalized revenue, or an internal attribution model, then reconcile revisions without silently changing historical logic.
The tip-jar analogy is useful because it captures the sequence behind the metric. The application is downloaded, the audience actively engages with the content, and an active user responds to the in-app monetization model by viewing an advertisement, making an in-app purchase, or signing up to a subscription. With each response, the app earns revenue. Payments and attributed earnings are summed on a daily basis, and an average is taken to determine the amount generated per active user.
For people who dislike complicated math, calculating ARPDAU is refreshingly straightforward. Take daily income and divide it by the number of daily active users. The calculation is simple, yet the metric can tell you a great deal when definitions remain consistent and the result is read alongside engagement, conversion, and retention.
Pokémon GO as an ARPDAU case study
Pokémon GO offers a memorable example because its revenue model was not limited to purchases made inside the game. The game sends players to locations in the physical world. In its early years, that included sponsored locations associated with businesses such as McDonald’s and Starbucks.
The experience was easy to see in places such as Hyde Park: players moved through real space to find in-game characters and visit points of interest. Sponsored locations gave businesses a way to attract foot traffic, while the game could earn revenue from attributed visits. That 2016 launch-era mechanism remains a useful monetization lesson. Niantic’s current sponsored-locations policy still describes eligible physical businesses and sponsored in-game locations.

For a simplified sponsored-location calculation, the app would divide sponsorship revenue attributed during 24 hours by the number of daily active users during the same 24 hours:
Sponsored-location ARPDAU = daily sponsorship revenue / daily active users
This model illustrates why ARPDAU is useful. A product team can compare days with different offers, events, partner locations, or user cohorts. The result shows how much daily revenue the entire active base produced on average, not just how many people completed a paid action.
Pokémon GO created an innovative income-generating model by connecting a digital experience with visits in real space. The reason players circled places such as Hyde Park was not a new fitness regime. They were trying to capture characters and reach points of interest. Those places could include businesses that provided sponsorship in return for visiting customers. The cost-per-visit model showed that app monetization could extend beyond conventional advertisements and in-app purchases.
The broader lesson is to look for a money-making strategy that fits the core behavior of the product. A location-based game can connect engagement to physical visits. A learning app might connect value to completed lessons or premium practice. A collaboration app might use subscriptions tied to useful capabilities. Monetization works best when the income stream supports the experience instead of interrupting it.
Why ARPDAU is important
ARPDAU provides rapid feedback. Because it uses a one-day window, it can reveal the effect of a pricing change, a live event, a new ad placement, a subscription prompt, or an in-app purchase bundle soon after launch. That speed makes it valuable for operational monitoring and controlled experiments.
There is no universal healthy ARPDAU benchmark. Results vary substantially by category, geography, platform, audience, season, payer mix, and revenue model. Compare your number with your own historical baseline and with genuinely comparable products. Record changes in DAU, payer conversion, retention, ad impressions, purchase frequency, and revenue mix so you can explain why the metric moved.
Teams commonly use ARPDAU to:
- monitor short-term monetization trends;
- compare cohorts, countries, platforms, or acquisition channels;
- measure the impact of live operations and promotional events;
- evaluate ad frequency and placement;
- track in-app purchase and subscription experiments; and
- detect data-quality issues when revenue and engagement move unexpectedly.
Daily sensitivity is also ARPDAU’s limitation. Weekends, holidays, campaigns, platform featuring, outages, and delayed ad revenue can create noise. Use a rolling seven-day view alongside the daily number, and avoid making a major decision from a single spike or dip.
A practical dashboard can show current ARPDAU, a seven-day moving average, the equivalent weekday from the previous week, and the same period from the previous month. Add DAU, total revenue, payer conversion, ARPPU, and revenue by source. If ARPDAU moves, this layout helps distinguish a change in the size of the active base from a change in advertising or purchase behavior.
Due to the short time frame ARPDAU measures revenue over, the metric can show how changes or events impact earnings. A team might alter the placement of advertisements, revise subscription prices, or try a campaign. ARPDAU can reveal positive or negative trends and indicate where to investigate further. It provides an immediate measure for a specific subset of the overall user base, while longer-period measures keep that daily signal in perspective.
Understanding ARPU, its calculation, and its importance
ARPU stands for average revenue per user. It measures the revenue generated per defined user during a stated period. The period might be a week, month, quarter, or billing cycle. Unlike ARPDAU, ARPU does not inherently require a 24-hour window or a daily active-user denominator.
The formula is:
ARPU = revenue during the period / users during the period
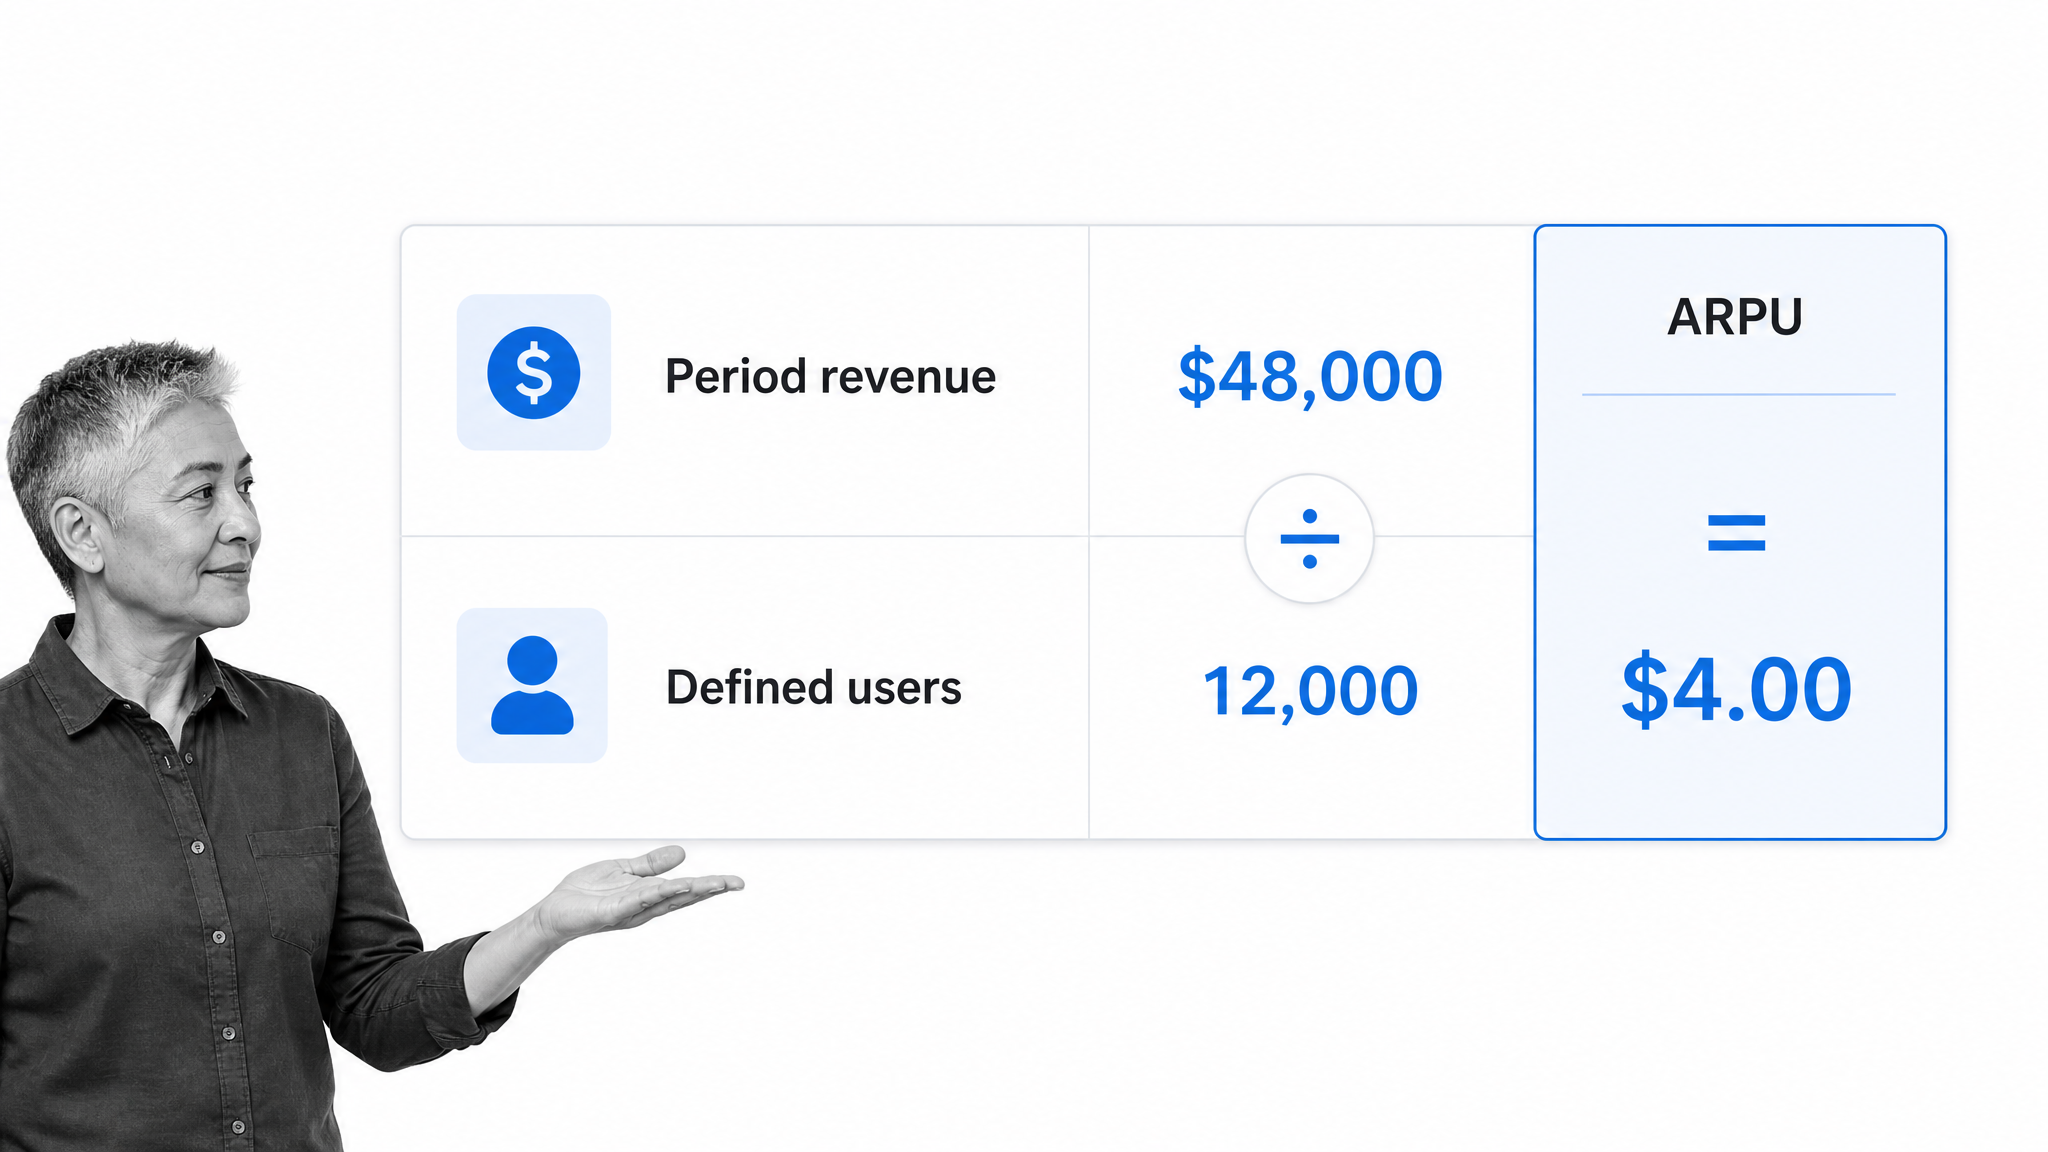
If a subscription app generates $48,000 during a month and defines its monthly user base as 12,000 users, monthly ARPU is $4.00. Always state the period and the user definition. An ARPU value without that context is incomplete.
Some businesses calculate ARPU using all registered users, some use active users, and subscription businesses may use paying accounts. These are legitimate choices if they are documented and applied consistently, but they are not interchangeable. Adjust’s ARPU overview and Stripe’s ARPU guide both emphasize the need to connect the formula to a clear business period and population.
A subscription app ARPU example
Imagine an app with a free plan, a $5 monthly plan, and a $12 monthly plan. During April it records $80,000 in recognized subscription and in-app revenue across 20,000 monthly users. Its April ARPU is $4.00.
Now suppose May revenue increases to $92,000 while monthly users rise to 25,000. Total revenue grew, but ARPU fell to $3.68. The decline might reflect a healthy influx of new free users, weaker conversion, a shift toward the lower-priced plan, discounts, churn among high-value users, or a reporting change. ARPU tells the team where to look, but the supporting metrics explain what happened.
This is why historical products that have shut down should not be treated as current benchmarks. Their launch economics, acquisition conditions, and reporting periods may be interesting context, but a worked example with explicit definitions is more useful for ongoing decision-making.
Cohort ARPU can make the metric more diagnostic. Instead of putting every user into one denominator, compare users acquired through different campaigns, users on different platforms, or customers who started in different months. A channel may deliver a lower acquisition cost but also a lower ARPU and weaker retention. Looking only at signup volume would hide that tradeoff.
Calculating ARPU is like calculating ARPDAU with two small but significant differences. The fixed 24-hour period is removed, and the defined user base may include more than daily active users. The reporting period must therefore be specified whenever the metric is shared. ARPU for different periods can be tracked over time, and values using the same definition and period can be compared between cohorts or products.
Why ARPU is important
ARPU translates the relationship between the user base and revenue into a comparable rate. It can help a team track period-to-period performance, compare acquisition channels, assess packaging and pricing, model lifetime value, forecast revenue, and understand whether growth is becoming more or less valuable.
As with ARPDAU, there is no universal ARPU target. A free-to-play game, an ad-supported utility, and an enterprise subscription product have different economics. Build a baseline from your own data, segment it where useful, and compare like with like.
By calculating ARPU, a team can track period-to-period performance, compare revenue across acquisition channels, identify the monetization models and plans that audiences prefer, and forecast revenue growth during the period considered. Location, industry, pricing model, and product maturity all influence the result, so context matters more than a generic benchmark.
ARPU vs. ARPDAU
ARPU and ARPDAU use the same basic structure, revenue divided by users, but answer different questions:
- ARPDAU uses daily active users. ARPU uses whatever user population is defined for the reporting period.
- ARPDAU is fixed to a day. ARPU can cover any clearly stated period.
- ARPDAU is operationally sensitive. It is well suited to live events and fast monetization experiments.
- ARPU is broader. It is useful for pricing, packaging, forecasting, channel economics, and longer-term trends.

Use ARPDAU when you want to know whether today’s active audience generated more or less value than a comparable daily audience. Use ARPU when you want to understand revenue per user across a business period. Use both when short-term product behavior must be reconciled with the wider revenue picture.
For example, ARPDAU may increase after a well-targeted in-game event while monthly ARPU remains flat because the event reached only a small segment. The reverse can also happen: monthly ARPU may rise after annual renewals even though daily in-app monetization is unchanged.
ARPPU adds a third useful view. Because it divides revenue by paying users only, it isolates payer value. If ARPDAU declines while ARPPU is steady, payer behavior may be unchanged and the shift may come from a larger active non-paying population or a lower conversion rate. If ARPPU also declines, the team can inspect purchase mix, discounting, or payer engagement.
To recap, ARPDAU considers only active users in its calculation, whereas an ARPU definition may look at a wider user population. ARPDAU calculates over a period of 24 hours, whereas ARPU can be calculated over any period as long as it is stated. These differences give the metrics slightly different views of application performance. ARPU reflects the wider effectiveness of a monetization strategy. ARPDAU highlights the immediate result among the daily active audience.
ARPU vs. ARPDAU: How to improve both values
Improving either metric means generating more appropriate value from the defined user base without damaging retention, trust, or the product experience. Revenue changes should always be evaluated with guardrails such as retention, session quality, refund rate, app-store ratings, support volume, and long-term value.
How to increase your ARPDAU
- Use rewarded ads where they add value. An opt-in reward can fit naturally into a game or utility when the exchange is clear. Measure completion, revenue, session quality, and retention instead of optimizing impressions alone.
- Create relevant in-app purchase paths. Show offers when users understand the benefit. Bundles, consumables, cosmetic upgrades, and subscriptions should match the product’s engagement loop.
- Test ad placement and frequency. Poor timing interrupts the experience and can increase churn. A/B test placements, apply frequency caps, and watch retention alongside ARPDAU.
- Segment users thoughtfully. New users, returning users, payers, non-payers, countries, and acquisition cohorts may respond differently. Relevant experiences can improve monetization without treating every user the same.
- Improve payer conversion. Clarify value, reduce checkout friction, and make purchase restoration reliable. Do not hide costs or use manipulative patterns.
- Run controlled live events. Events can create reasons to return and spend, but compare them with a baseline and account for cannibalization from future purchases.
Seasonality and special events can influence the metric even when nothing in the product changes. Annotate the reporting timeline and compare equivalent weekdays or rolling periods. A higher ARPDAU is useful only when the underlying user experience remains healthy.
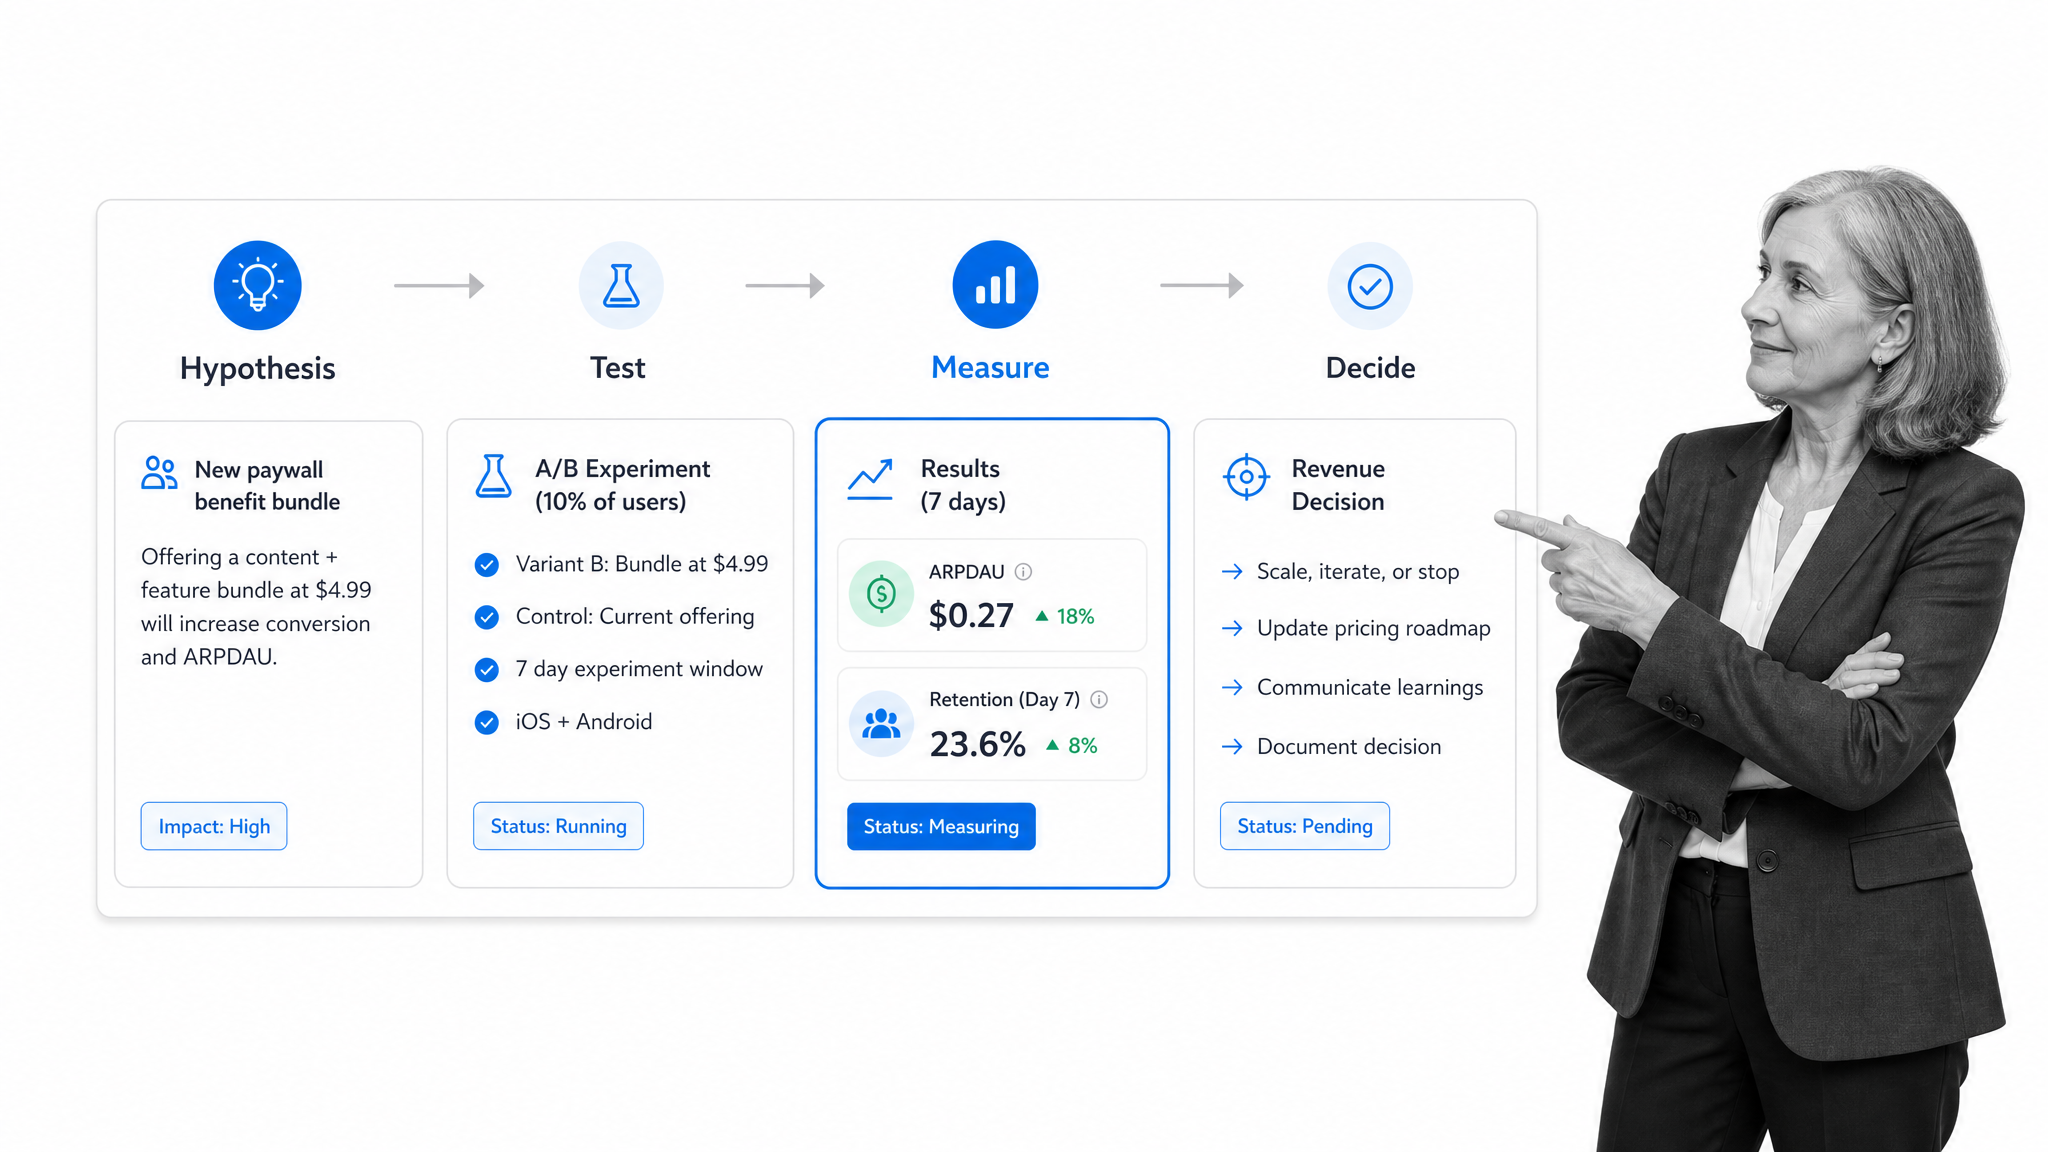
Run experiments long enough to capture normal behavior. A test that starts on Friday and ends on Sunday may overrepresent weekend activity. Predefine the minimum duration and sample requirement, and avoid stopping as soon as the primary metric looks favorable. Confirm that any lift persists and that the experiment did not simply pull revenue forward from a later date.
Several controllable factors can increase ARPDAU. Rewarding videos can give an audience a reason to engage, but the reward and timing must be appropriate. Teams can nudge non-paying users toward in-app purchases by communicating relevant value, not by adding pressure. Ad placements should be tested so they do not interrupt the experience, and frequency should be capped. Segmentation can tailor offers to different behavior, purchase history, platform, or lifecycle stage.
External factors beyond a team’s control, including seasonal changes, holidays, and platform events, can also affect ARPDAU. Recording those factors helps separate the impact of a product change from normal variation. The purpose of an experiment is not merely to see ARPDAU increase, but to understand why it increased and whether the effect is repeatable.
How to increase your ARPU
- Align packaging with customer value. Plans should grow with meaningful usage, capability, service, or outcomes rather than arbitrary friction.
- Price with evidence. Test willingness to pay, review competitor context, and model margin and retention before changing prices.
- Improve retention. Keeping customers who receive value can raise lifetime revenue and stabilize period ARPU. Fix activation and product-quality problems before relying on upsells.
- Identify responsible expansion moments. Offer upgrades or add-ons when a customer has a clear need. Use behavior and lifecycle signals, not indiscriminate prompts.
- Improve acquisition quality. Channels that deliver many low-intent users may suppress ARPU even if signup volume looks impressive. Compare cohorts by revenue, retention, and payback.
- Review revenue leakage. Failed payments, unclaimed renewals, missing entitlements, refund problems, and inconsistent billing data can depress ARPU without a product problem.
Every monetization change should start with a hypothesis, target population, primary metric, guardrails, and decision rule. Otherwise, teams risk celebrating a short-term revenue lift that harms the longer-term business.
Measure the complete outcome. A price increase can raise immediate ARPU but weaken conversion or retention. A discounted annual plan can lower this month’s recognized revenue under one reporting method while improving cash flow and lifetime value. Finance, analytics, and product teams should agree on revenue recognition and evaluation windows before interpreting the test.
ARPU also encourages a business to think from the ground upward. Is there enough growth potential in the product and its packaging? Does value expand as the audience becomes more successful? Pricing can be adjusted and evaluated, but the right amount depends on the value delivered. Rather than learning who to ignore, teams should identify where investment has the greatest potential while continuing to serve every customer fairly.
Upselling and cross-selling should happen at useful touch-points. Past behavior can identify moments when an upgrade is likely to benefit an audience, such as approaching a genuine usage limit or needing an advanced capability. A/B testing can identify effective timing, but retention, satisfaction, and support signals must remain part of the decision.
How to use Process Street to improve ARPU and ARPDAU
Knowing which changes might improve ARPU and ARPDAU is only the start. Teams also need a reliable way to propose experiments, assign work, collect evidence, approve launches, and document decisions.
Process Street is a Compliance Operations Platform for teams that need work to run correctly and consistently. It is a single product with Docs and Ops capability areas plus built-in AI. Teams can document the operating method, run it as a workflow, capture structured data, route approvals, and maintain an audit trail in one place.
For app monetization work, a team can use Process Street’s workflow app to standardize the experimentation lifecycle. A workflow can require the owner to record the hypothesis, audience, baseline, expected effect, data sources, risk review, launch plan, and rollback conditions before an experiment starts.
Useful controls include conditional logic, assignments, due dates, approvals, form fields, and integrations. Built-in AI can help teams summarize evidence, draft analysis, or identify missing information while the workflow keeps the decision path visible. The result is a repeatable operating process rather than a collection of disconnected documents and chat messages.
Docs can hold the policy, metric definitions, experiment standards, and review criteria. Ops can turn those requirements into an executable flow with required fields and accountable owners. When the process changes, teams can update the documented method and the operational workflow together, reducing the gap between what people are supposed to do and what actually happens.
Features such as dynamic due dates can help ensure no deadline is missed. Conditional logic can create a dynamic workflow that caters to the experiment’s needs. Role assignments support task delegation, while approvals allow decision-makers to give the go-ahead or reject a launch with necessary comments. Stop points and required fields can ensure that instrumentation, risk review, and rollback planning happen in the intended order.
The theory behind increasing ARPU and ARPDAU is useful, but success depends on the ability to implement changes. A repeatable workflow helps a team efficiently and effectively record and manage the operating process. It can turn a proposed monetization strategy into assigned tasks, visible evidence, a documented decision, and a controlled rollout.
Adjacent processes can also support the same objective: a usability test plan, customer feedback review, Facebook ad campaign, email marketing campaign, email scrubbing routine, graphic design process, Instagram marketing workflow, know-your-customer checklist, lead nurturing email sequence, logo design process, personalized marketing campaign, churn-reduction workflow, and visual content publishing checklist. Each can be adapted to the specific application and connected to the metrics it is expected to influence.
Using Process Street to optimize ads through A/B testing
Ad placement is a good example. The team begins with a testable hypothesis, such as: moving a rewarded-video offer to the end of a completed activity will increase ARPDAU without reducing seven-day retention.
A controlled workflow can then guide the team through these steps:
- define the control and variant;
- select the eligible user segment;
- record sample-size and experiment-duration assumptions;
- confirm analytics instrumentation;
- review privacy, platform, and user-experience risks;
- secure launch approval;
- monitor ARPDAU and retention guardrails;
- document the result and decision; and
- assign the rollout, revision, or rollback work.
The A/B testing template below provides a starting point that can be adapted to the app, experiment platform, and approval policy.
A workflow is especially helpful when several teams contribute to the result. Product defines the change, engineering implements it, analytics validates the event data, legal or compliance reviews risk, and growth monitors revenue. Clear ownership prevents an experiment from launching without the evidence needed to interpret it.
Optimize your app using ARPDAU and ARPU
ARPDAU measures daily revenue across daily active users. ARPU measures revenue across a defined user population and period. Both are simple ratios, but their value depends on consistent definitions, reliable data, thoughtful segmentation, and supporting metrics.
Start by documenting the revenue sources, user definition, time zone, and reporting period. Establish a historical baseline. Then connect changes in ARPDAU and ARPU to retention, conversion, payer behavior, acquisition quality, and product events.
Use ARPDAU for fast feedback on daily monetization and ARPU for the broader economics of the user base. Treat neither number as a universal score. The goal is not to maximize a ratio at any cost, but to build a product that creates durable value for users and a sustainable return for the business.
When a change is worth testing, run it through a defined process: state the hypothesis, protect the user experience with guardrails, collect trustworthy evidence, and record the decision. That discipline turns ARPDAU and ARPU from dashboard numbers into useful operating signals.