 Workflows
 Forms
Forms Data Sets
 Pages
Pages Process AI
 Automations
 Analytics
 Apps
Apps Integrations
 Property management
 Human resources
 Customer management
 Information technology


Customer Happiness is a metric unlike any other.
It’s not founded on principles of revenue, bounce rate or any other traditionally mathematical ideas.
Customer Happiness is based on emotions, not data. And while these emotions can be formulated as data, one of the first steps is to work out how.
In this blog post series we’ve already covered the definition of customer success, why customer success is important and churn for SaaS companies.
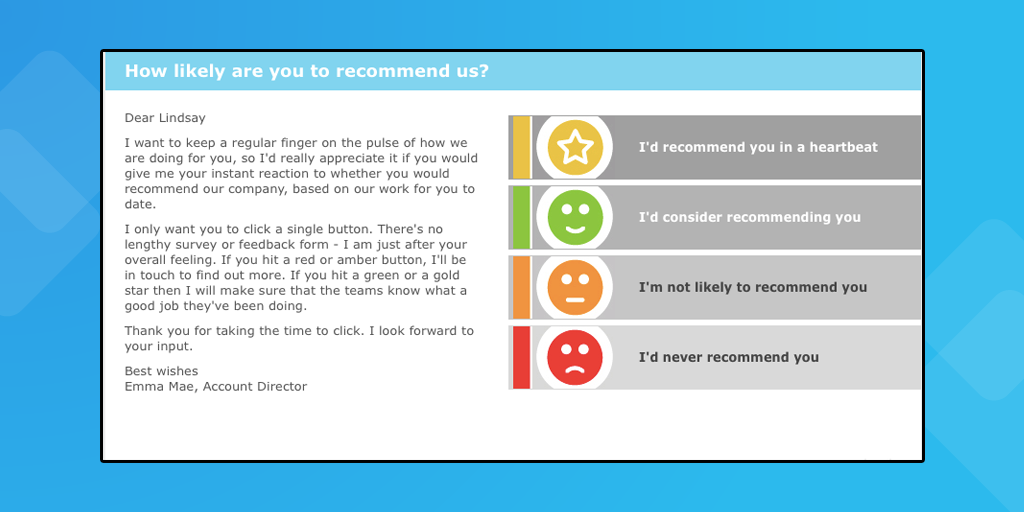
Have you ever received this email?
Chances are, you’ve got an email at some point that looks like this:
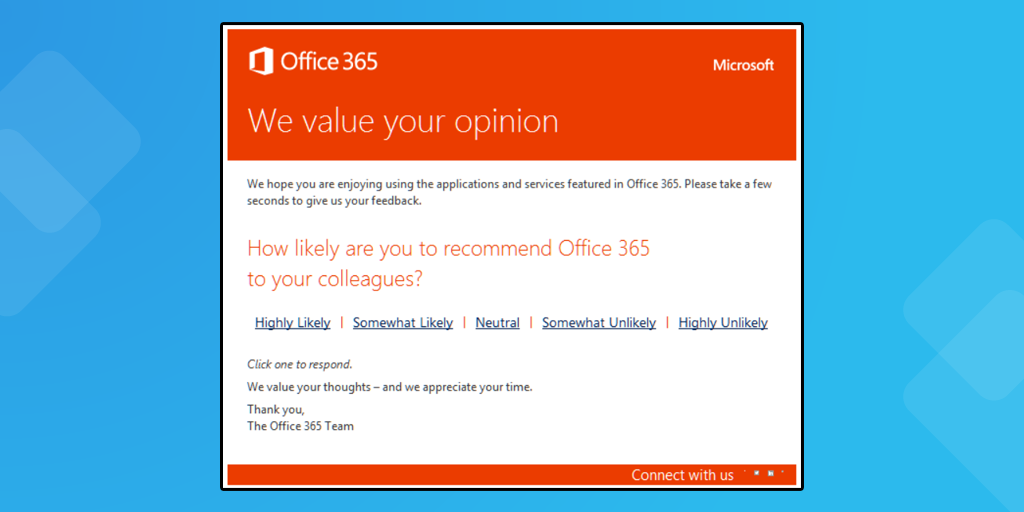
The outcome of this question is used to formulate your Net Promoter Score (NPS), one of the metrics that measures the health of your company and the effectiveness of your Customer Success strategy.
Some companies will ask for your response on a scale of 1-10, some in a series of phrases like the Microsoft example above. I’ve even seen 🙂 and 🙁 as options.
How do these responses translate to a solid representation of customer happiness?
Calculate NPS to determine customer happiness
Whatever the form of the survey, you can be sure it will be converted into a number between 1-10, and then you will be separated into 1 of 3 groups.
Scores between 1 and 6 are Detractors. These are the customers unlikely to buy more, refer and promote the business to those around them. If the customer base is filled with detractors, the company is in trouble.
Scores between 7-8 are Passives. These are the kinds of customers who are just fine. They’re getting what they paid for, and think the company offers a passable service. They have enough gripes with it not to scream your praises from the rooftops but aren’t too dangerous. Companies with lots of Passives aren’t in the best position, but it’s better than having lots of Detractors.
Scores between 9-10 are Promoters. These are the sorts you see retweeting product updates, commenting on every blog post and publically enthusing about their favorite companies. A company full of Promoters is like a great viral marketing campaign all by itself.
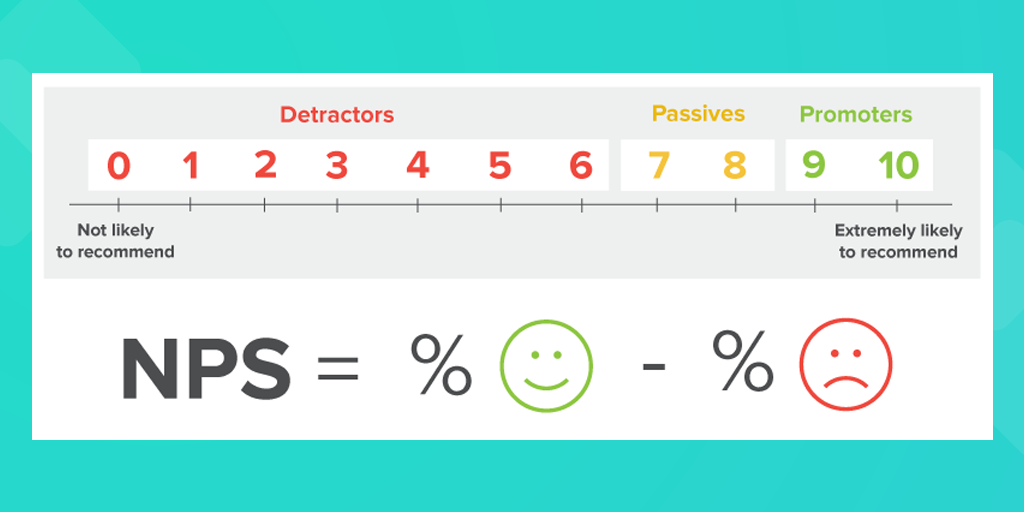
As hinted in the image above, your final NPS score is the net percent of your Promoters, minus your Detractors.
Since NPS scores fall inside a range of -100 to +100, you need to work out category scores as percentages.
For example:
You have 493 customers. 286 Passives (58%), 173 Promoters (35%) and 34 (7%) Detractors.
Discount the Passives, as they are effectively 0s, and subtract the % of Detractors from the % of Promoters. This leaves us with 28% (or +28).
To give you an idea as to what this means, any positive score is a triumph. Companies with a score of +50 or greater are considered to be doing amazingly well.
How to survey NPS data from your customers
The quick way is to send a survey. You can use something as simple as SurveyMonkey or even Google Forms to gather responses in a spreadsheet and work out your NPS.
The long way involves optimizing this process. It has quite a lot to it, so I’ll go through it bit-by-bit.
Option #1: Use a form provider
To make a good decision, answer the following questions.
- How many entries am I expecting?
- How is the collected data presented to me?
- What kind of reports should be generated?
- Where can it be embedded?
- Does it look professional?
- Can the form be branded/customized?
- Does it integrate with the apps you use?
Zapier has already put together a full blog post series on choosing a form provider, so I’ll leave that here for you to help make a decision after answering the questions above about your needs.
At Process Street, we use Typeform because it has a modern, professional look, allows customization and integrates with apps we use, so we can collect the data inside our existing SaaS stack.
Option #2: In-email surveys
To reduce the friction and make it more likely you’ll get a response, embed the survey directly into an email. This means that when the recipient clicks their response, it’s directly logged and they don’t have to jump through hoops for you.
You can set this up in email marketing programs, including CampaignMonitor, use Google Forms to embed a survey into your email directly or use trusty MailChimp, which lets you set up polls and gather the data in an easily-digestible way.
Option #3: In-app surveys
This doesn’t have to be an alternative to an email survey, you could do it as well to maximize the amount of responses. There are a few solid options for in-app surveys, which are best for SaaS companies and mobile apps.
One choice is to use Intercom’s Auto-Messaging system which comes built into their Engage package — that’s what we use here at Process Street.
Other options include a specific NPS survey that lives in your all —Bluenose’s Pulse, and FeedbackLite which you can get with a 14-day free trial.
Time it right
Make sure to send your NPS survey at a time where your product is fresh in your customer’s minds. This could mean setting up an automated email which triggers when a support ticket is closed, an account is upgraded, or, as Genroe’s Adam Ranshaw puts it: ‘soon after the service or transactional interaction’.
Finding the best time for your customers which gets the highest response rate is something specific to each company. You’ll have to test and find out what works for you. Adam says that the average response rate for a well-timed NPS survey over email should be 20-30%.
Optimize the style of your survey
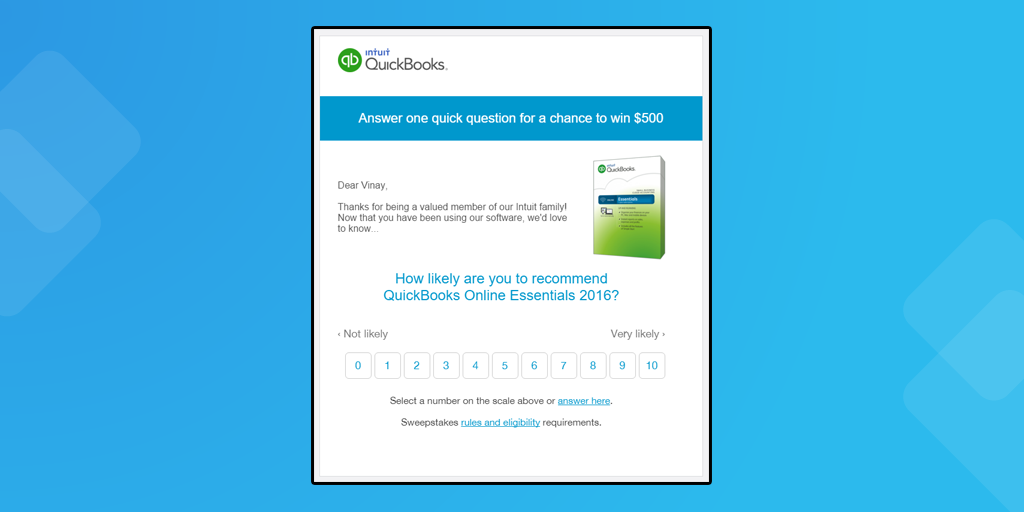
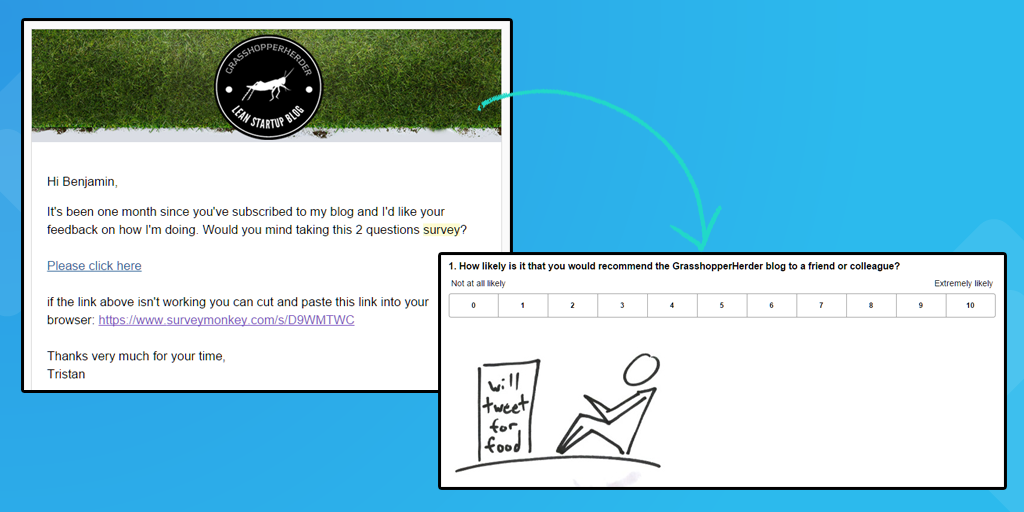
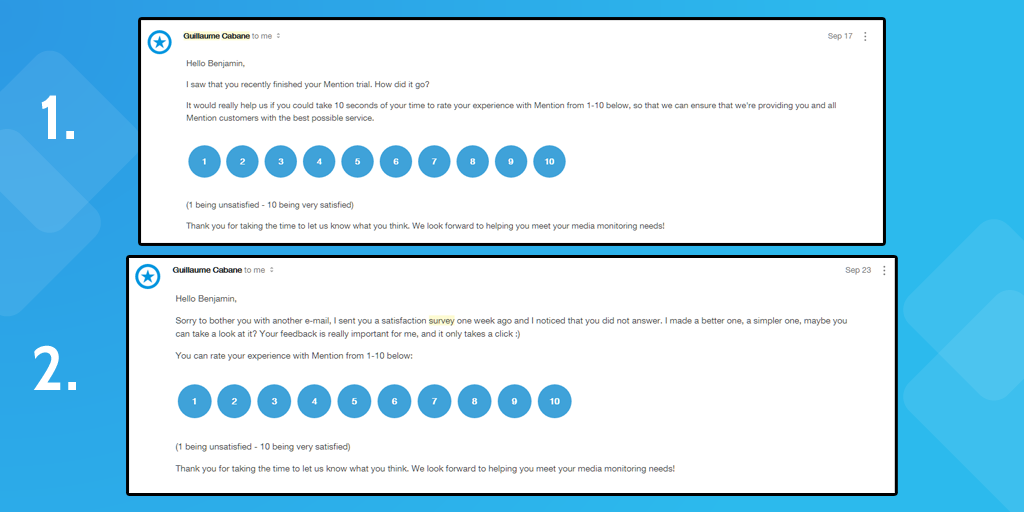
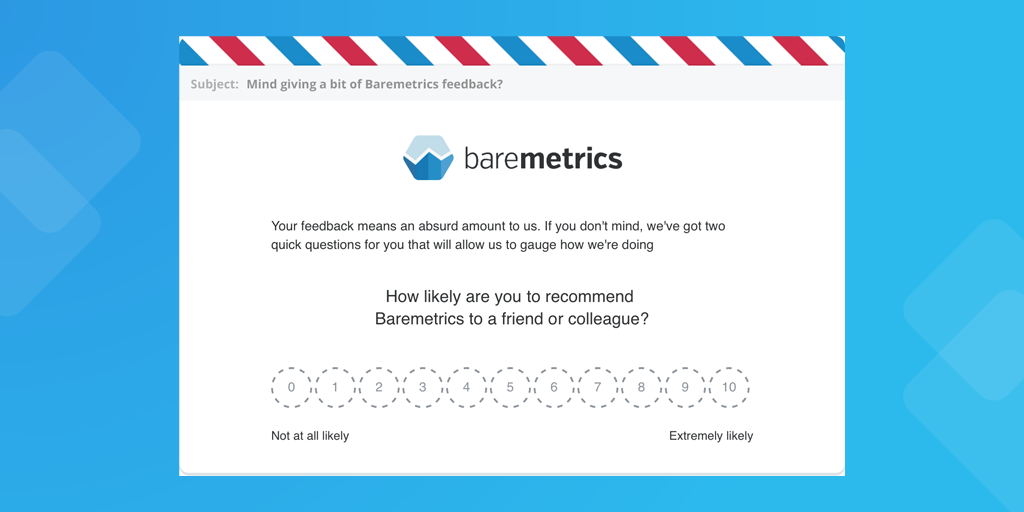
Making changes to the way your customers enter their data and the layout of the survey could boost your response rates and give you more data to work with. This is definitely something worth A/B testing so you can find out whether your customers prefer a set of phrases, emoticons, a scale of 1-10, etc. Here are some examples of NPS surveys to give you inspiration:
Quickbooks (with a contest as an incentive)
GrasshopperHerder Blog
Mention (original and follow-up)
Baremetrics
CustomerThermometer (example)
Load the template into your email marketing software
At Process Street, we use MailChimp to manage our email marketing. It has great reporting, A/B testing and is easy to create and edit templates with. Chances are, you’ve already got one picked out, but if not — you need one! That’s because you will have to track the opens and clicks to determine whether your NPS survey is working.
Here’s a list of quality email marketing software to check through if you haven’t got it set up yet:
- MailChimp: MailChimp has everything you’ll need for designing, sending and tracking NPS surveys.
- AWeber: Complete email marketing platform. Slightly more expensive than Mailchimp.
- InfusionSoft: A little on the expensive side, but full of useful features including a complete email marketing platform and CRM.
- GetResponse: Inexpensive — featuring A/B testing and forms.
- Benchmark: Intuitive, flexible editor. A much cheaper option than AWeber or MailChimp.
To send or to schedule?
Once you’ve got your survey, your email, and software to send them out to your customer base, it’s time to make another choice.
Are you going to blast the survey out to your whole list, or have it trigger based on events?
You can send the email out at a few key moments in the customer lifecycle:
- Before/after subscription renewal
- End of free trial
- After the customer onboarding process
- After X interactions with customer success, customer support, etc.
To get the best results, this option is preferable because it ensures your customers remember you which means you’ll get a better response rate and more objective data.
What’re you going to do with all that data?
Provided you have a way to collate the responses (this will be easy if you’ve done it through a form service like Typeform or Wufoo), it should be easy enough to calculate your NPS score. Just follow the formula I gave you earlier. In case you’re in need of a refresh, here it is again:
Your final NPS score is the net percent of your Promoters (scored 9-10), minus your Detractors (scored 1-6). Discount any other data.
Since NPS scores fall inside a range of -100 to +100, you need to work out category scores as percentages.
Subtract the percentage of Detractors from the percentage of Promoters to get your NPS score.
Remember, any positive result is a good NPS score. Any NPS over 30 is considered good, over 50 is great, and over 70 is excellent.
Take action to make improvements
Over the next 6 weeks, I’ll be writing about how to optimize your customer success strategy with concierge onboarding, by improving user experience and by getting a support team running round the clock to solve your customers problems and build relationships.
Once you know your NPS score, you know how urgent this will be. To know where you’re going, you need to know where you are right now.
Stick around until next week and we’ll continue this guide on customer success for SaaS companies.
In the meantime, leave me a comment, share this with your followers and make sure to subscribe to the blog using the box below. 🙂
Get the Ebook: The Complete Guide to Customer Success for SaaS Companies
Make your customers happy, and keep them paying the subscription.

This guide will teach you how to stop users abandoning your software before they’ve seen how awesome it is.
You’ve put 90% of your effort into building and promoting your app…
…But it all goes to waste if you’ve not got a system to manage existing customers. This includes a proper support and success process aimed at making sure that most recently subscription payment you got through won’t be the last.
Get the book to start keeping your customers, compounding your revenue and boosting every customer’s lifetime value.

What’s in the book?
- What is Customer Success?
- Why is Customer Success Important?
- What is Churn?
- How to Calculate NPS with the Perfect Customer Happiness Survey
- How to Shape Customer Retention Strategies That Beat Churn
- A Smart Way to Manage SaaS Customer Support
- Enhance Your SaaS User Experience
- How (and When) to Automate Your Customer Success Process
- What Customer Success Managers Actually Do All Day
Benjamin Brandall
Benjamin Brandall is a content marketer at Process Street.