

Turn every policy into automated workflows with built-in enforcement and audit-ready proof.



Form Analytics
Form analytics is the measurement of how people encounter, start, complete, abandon, and submit a form, plus what happens to the submitted data afterward. It turns a form from a static collection surface into a measurable part of an operating process.
Basic analytics tells you how many submissions arrived. Useful form analytics explains where friction occurs, which fields create hesitation, whether tracking is reliable, which segments struggle, and whether a completed form produced a valid business outcome.
This guide covers the metrics, event design, analysis methods, privacy controls, and improvement workflow needed to make form data actionable. It also shows how Process Street can turn an analytics finding into assigned, approved, and verified work.
In this article, we are going to cover:
- What is form analytics?
- Why form analytics matters
- Form analytics metrics that matter
- How to implement reliable form analytics
- How to analyze form performance
- Form analytics privacy, governance, and data quality
- Turn form analytics into action with Process Street
- FAQs
What is form analytics?
Form analytics combines quantitative funnel data with qualitative evidence about user behavior. Quantitative data shows how many people viewed, started, progressed through, and submitted the form. Qualitative evidence helps explain why they hesitated, failed, or left.
Form analytics is more than submission count
Submission count is an output, not a diagnosis. Ten submissions could represent excellent performance from twelve qualified visitors or poor performance from ten thousand visitors. The number becomes useful only when it is connected to exposure, intent, completion, data quality, and the business result.
It covers the full form journey
The journey begins before the first field receives focus. A visitor must understand the offer, trust the page, find the form, and decide the effort is worthwhile. It continues through field entry, validation, correction, submission, confirmation, and any follow-up workflow.
It connects behavior to operations
A submitted form may trigger qualification, approval, onboarding, service, purchasing, or compliance work. A controlled form workflow connects the response to owners, deadlines, decisions, and evidence. Form analytics should measure that operational result, not stop at the submit button.
It uses several evidence layers
- Traffic and acquisition data shows who reached the form.
- Event data shows starts, field progress, validation, and submissions.
- Behavior evidence such as recordings and click maps shows visible friction.
- Response data shows completeness, validity, and qualification.
- Workflow data shows whether the organization acted on the response correctly.
Why form analytics matters
Forms often sit at high-value handoffs: lead capture, support requests, applications, inspections, audits, onboarding, approvals, and internal requests. A small form defect can therefore create lost demand, bad data, delayed work, or unprovable decisions.
It separates traffic problems from form problems
A low submission count can come from weak traffic, weak intent, a confusing offer, a technical failure, unnecessary fields, poor mobile design, or a broken follow-up. Form analytics separates these causes so the team fixes the constraint instead of redesigning everything.
It reveals hidden friction
A form can look fine to its creator while users struggle with a label, required field, date format, error state, or mobile keyboard. Field-level events, validation errors, repeated clicks, and session evidence reveal problems that aggregate conversion rates cannot explain.
It protects data quality
Higher completion is not enough if submissions are incomplete, duplicated, fraudulent, misrouted, or impossible to use. Useful form analytics tracks valid submissions, rejected responses, missing values, duplicate rate, and the share of submissions that become successful downstream work.
It creates a disciplined improvement loop
A form dashboard makes patterns visible. A governed process improvement loop turns those patterns into hypotheses, changes, tests, approvals, and verified outcomes. The analytics and the operating process need each other.
Form analytics metrics that matter
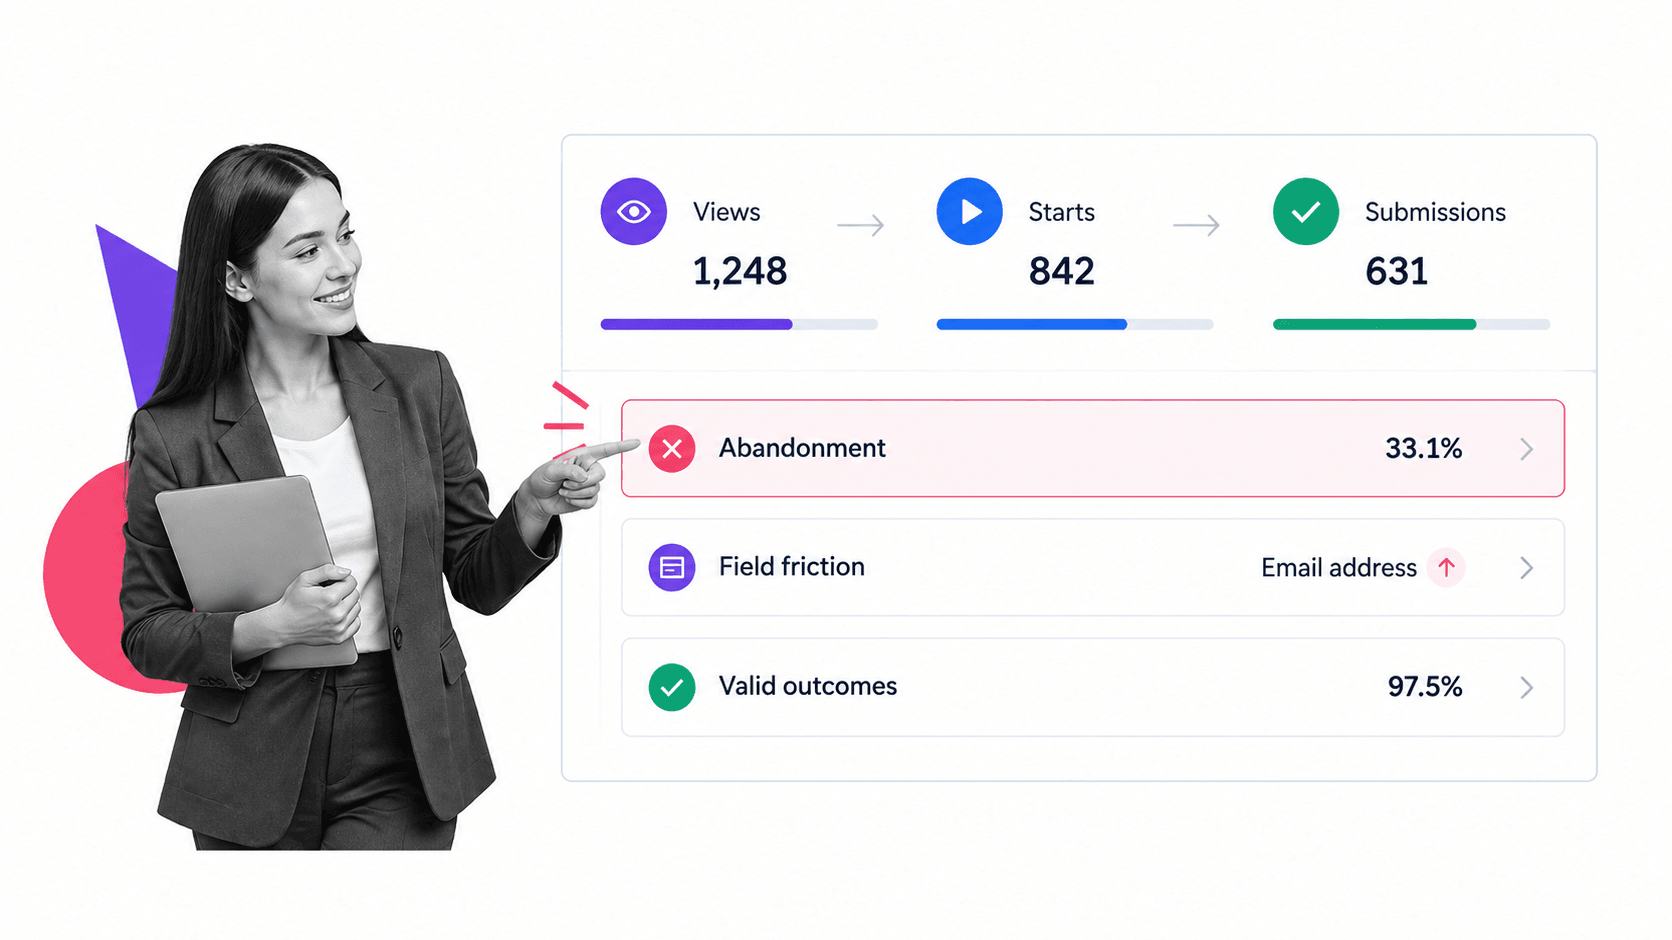
The right metric set follows the form journey from exposure to outcome. Avoid collecting dozens of numbers without a decision attached. Each metric should help the team find friction, protect data quality, or improve the result.
Form views
Form views count sessions or users who had a meaningful opportunity to see the form. Define the exposure rule carefully. A page view is not a form view when the form sits far below the fold, loads conditionally, appears in a modal, or fails to render.
Form starts
A start usually means the first meaningful interaction with a field. Google Analytics enhanced measurement documents form_start and form_submit events, which can provide a baseline when the implementation fits the form. Validate the events against the actual form because embedded, custom, or multi-step forms may require deliberate instrumentation.
Start rate
Start rate is form starts divided by meaningful form views. It helps distinguish a weak value proposition or intimidating first impression from friction that occurs after entry begins. Segment it by page, campaign, device, and form version.
Submission and completion rate
Submission rate is successful submits divided by meaningful form views. Completion rate is successful submits divided by starts. Both are useful because one measures the whole opportunity and the other isolates the experience after a person begins.
Abandonment rate
Abandonment rate is started sessions without a successful submit divided by starts. Treat it as a diagnostic signal, not proof that one field caused the exit. People leave for many reasons, including low intent, interruptions, security concerns, missing information, technical errors, and unclear expectations.
Field-level hesitation and drop-off
Field focus, blur, correction, validation error, and last-interacted-field events can show where users struggle. Adobe’s form analytics guidance documents conversion, abandonment, and field-level measures. The strongest diagnosis combines those signals with recordings, user feedback, and controlled testing.
Validation error rate
Track errors by field and error type. A required-field error suggests missing information. A format error may point to unclear examples or rigid validation. A server error indicates a technical failure. Do not merge them into one generic error count.
Time metrics
Time to start, time per step, time between fields, and total completion time can identify hesitation. Long time is not always bad. An application or compliance form may require documents and careful judgment. Compare similar form versions and segments before declaring friction, then use workflow analytics to examine the operational stages that follow submission.
Qualified or valid outcome rate
The most useful denominator often extends beyond submission. Track the share of responses that are valid, qualified, approved, fulfilled, booked, activated, or otherwise successful. This prevents a shorter form from appearing better when it simply produces lower-quality work.
Operational follow-through
Measure time to assignment, time to first action, overdue rate, approval time, rejection reason, rework, and final completion. Workflow monitoring closes the gap between user conversion and operational execution.
How to implement reliable form analytics
Reliable analysis starts with a measurement plan. Decide what each event means, which identifiers connect the journey, what data is prohibited, and how you will verify that the numbers match reality.
Define the form outcome
State the form’s business purpose before naming events. The outcome may be a valid lead, approved request, completed application, resolved service issue, passed inspection, or activated account. This determines which downstream systems and statuses belong in the analysis.
Create an event dictionary
Document event name, trigger, required properties, prohibited properties, owner, destination, and test case. Typical events include form_view, form_start, step_view, field_error, form_submit_attempt, form_submit_success, confirmation_view, and workflow_outcome.
Use stable identifiers
A stable form ID, version ID, and submission ID help reconcile analytics events with response records and workflow outcomes. Avoid putting email addresses, names, free-text responses, or sensitive values into analytics properties. Use controlled categories and non-sensitive identifiers.
Instrument success, not only clicks
A click on Submit is not a successful submission. The browser may reject the form, the server may fail, or the response may not reach its destination. Fire the success event only after the system confirms acceptance, then verify the response appears where the business expects it.
Test every path
Test desktop and mobile, each browser family that matters, all conditional branches, client and server validation, slow networks, duplicate submits, authentication states, embedded forms, consent states, and confirmation behavior. The W3C form tutorials provide a durable accessibility reference for labels, instructions, validation, and notifications. Compare test submissions across analytics, the response store, and the downstream workflow.
Treat the form endpoint as an internet-facing input surface. The OWASP Web Security Testing Guide provides a structured reference for testing input validation, authentication, session behavior, and other web security controls.
Monitor tracking health
A form engine or analytics implementation can change when fields, validation rules, embeds, and page templates change. Add checks for sudden event loss, impossible conversion rates, duplicate events, unknown form versions, and mismatched submission totals.
How to analyze form performance
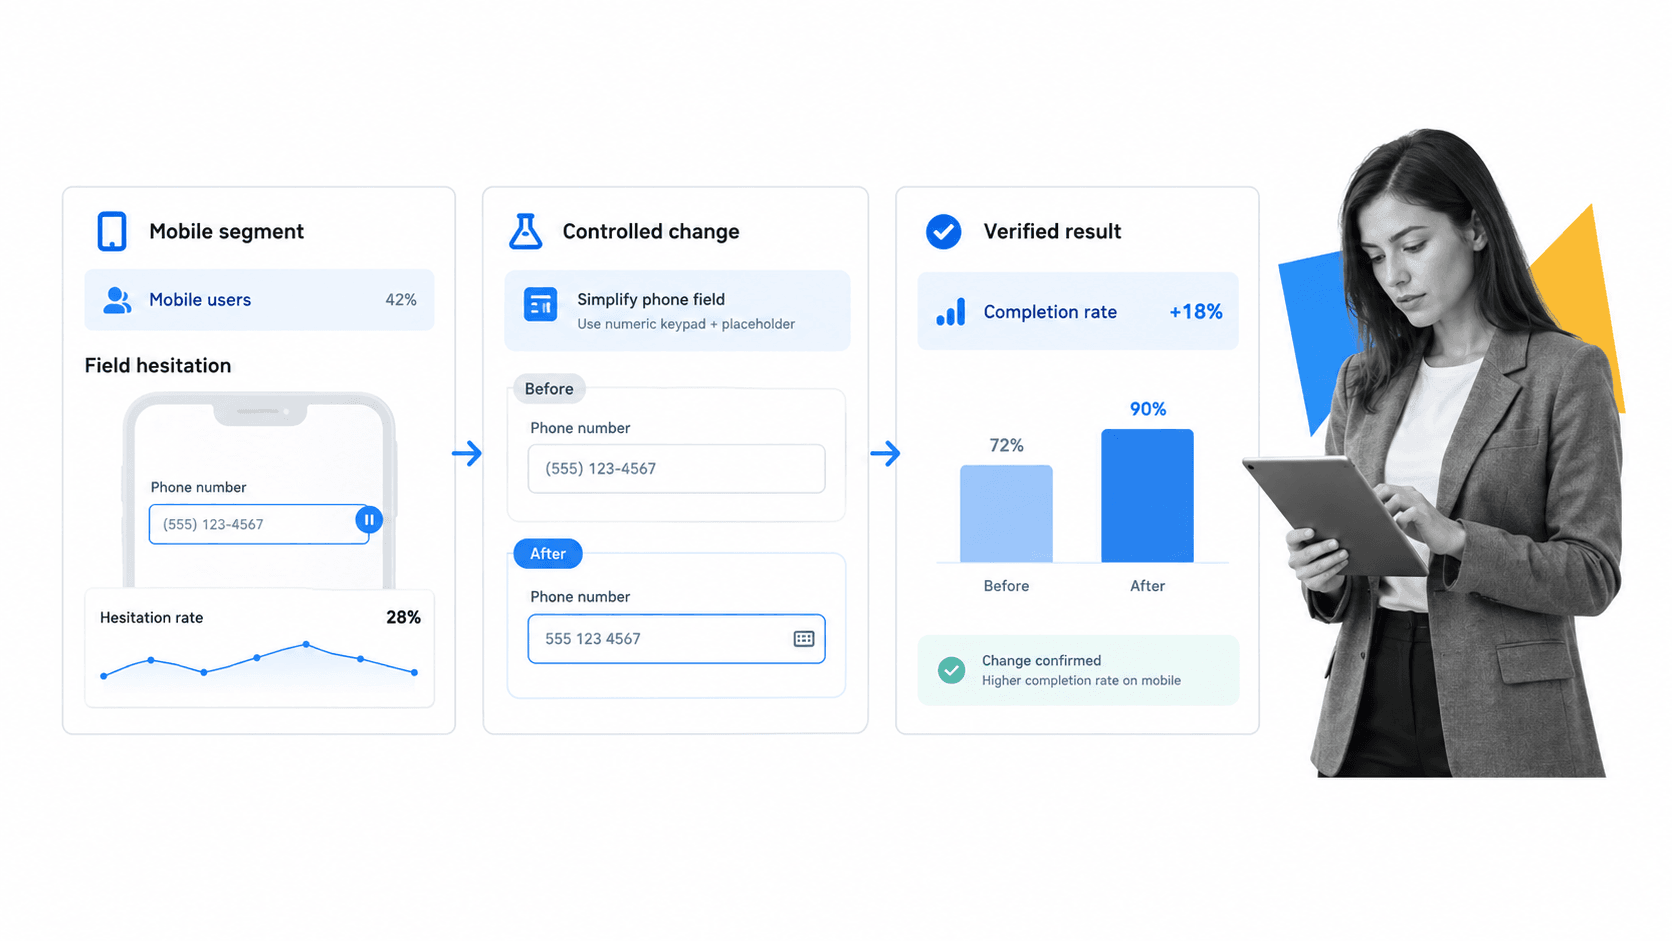
Analysis should move from signal to segment to evidence to test. A dashboard tells you where to look. It does not automatically explain why the behavior occurred or which change will improve it.
1. Confirm the data is trustworthy
Before interpreting a decline, check tracking changes, form versions, traffic mix, consent behavior, bot filtering, outages, and duplicate events. Reconcile successful submissions against the response store. A measurement defect can look exactly like a conversion problem.
2. Build the funnel
Start with meaningful form views, starts, successful submissions, valid responses, and completed outcomes. Compare counts and rates. This reveals whether the largest loss occurs before interaction, during entry, at submission, during qualification, or inside follow-up work.
3. Segment before averaging
Break the funnel down by device, browser, traffic source, campaign, page, geography when appropriate, form version, new versus returning visitor, and workflow path. A stable overall rate can hide a serious mobile or browser failure.
4. Locate field and step friction
Look for high error rates, repeated correction, long hesitation, backtracking, and exits after a specific step. For multi-step forms, compare entry and completion for each step. Treat the last field touched as a clue, not a verdict.
5. Review behavior evidence
Microsoft Clarity documentation covers click maps, session recordings, rage clicks, and dead clicks as ways to understand interaction. Use recordings to see error loops, unclear controls, hidden buttons, failed clicks, and mobile layout problems. Mask sensitive inputs and follow applicable consent requirements.
6. Inspect the response data
Review invalid, incomplete, duplicate, spam, and low-quality submissions. A high conversion rate with poor qualification may indicate that the form is too permissive or that the promise attracts the wrong intent. A low rate with excellent outcomes may still be economically strong.
7. Form a specific hypothesis
Write the problem, affected segment, observed evidence, proposed cause, change, expected result, risk, and success metric. A useful hypothesis is narrow enough to test. ‘Improve the form’ is not a hypothesis.
8. Change one meaningful constraint
Possible changes include clarifying the offer, setting expectations, removing a nonessential field, changing field order, improving input controls, rewriting an error message, enabling save and return, simplifying mobile layout, or moving high-friction questions after qualification. Use a focused workflow optimization cycle so the team changes the actual constraint instead of polishing a low-impact detail.
9. Verify the downstream result
Check that the change improves valid outcomes, not only submissions. Confirm that operations can process the responses, approvals remain effective, integrations still map correctly, and the new experience does not create avoidable rework.
10. Record the decision
Document the evidence, approved change, release date, owner, measurement window, result, and follow-up. This prevents teams from repeating failed experiments or forgetting why a field exists.
Form analytics privacy, governance, and data quality
Form analytics can expose sensitive behavior and data. Governance should be designed before instrumentation, not added after a privacy review finds that raw field values or recordings were collected unnecessarily.
Collect the minimum
Do not send names, email addresses, phone numbers, account numbers, health data, financial data, free-text responses, passwords, or uploaded documents into general analytics tools. Prefer event categories, field IDs, error types, and non-sensitive form or version identifiers.
Apply consent and retention rules
Analytics, recording, advertising, and essential operational data may have different consent and retention requirements. Configure each tool for the jurisdictions, audiences, and data types involved. Keep a record of why the data is collected and when it is deleted.
Protect recordings and access
Mask inputs, exclude sensitive pages where necessary, restrict access by role, and review vendor controls. Session evidence is valuable precisely because it is detailed. That detail also increases the need for careful governance.
Govern metric definitions
A team cannot compare results when one dashboard defines a start as first focus and another defines it as any page view. Keep shared definitions, version them, and require changes to include a test plan and owner.
Turn form analytics into action with Process Street
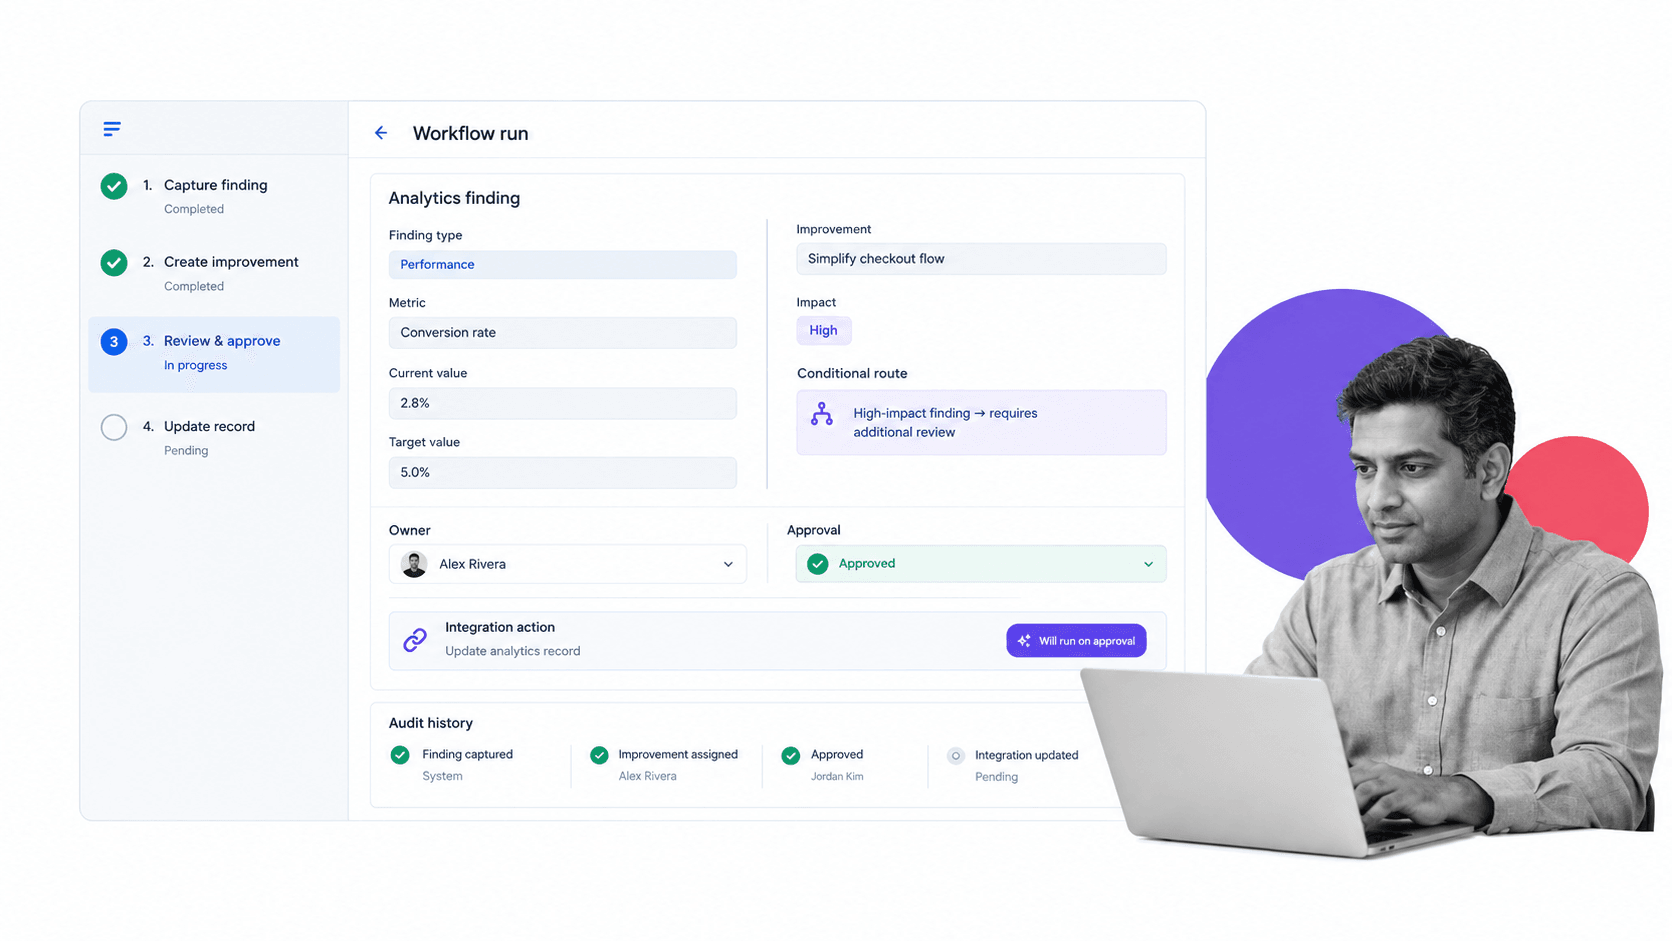
Form analytics creates value when an insight becomes owned work. Process Street can turn a finding into a repeatable improvement workflow with evidence, assignments, conditional review, approvals, system actions, and a record of the result.
Capture the finding
Start a workflow when a threshold breaks, a reviewer identifies friction, a tracking-health check fails, or a scheduled analysis finds an opportunity. Capture the form, version, segment, metric, evidence link, impact, confidence, and proposed owner as structured fields.
Route by impact and risk
Conditional logic can send a cosmetic issue through a lightweight path while routing a privacy problem, failed submission, or high-value conversion loss to additional review. Owners and due dates become part of the workflow instead of a message that can disappear.
Approve material changes
Approval gates can protect changes to required fields, qualification logic, consent language, sensitive data collection, integrations, or regulated processes. The approver sees the evidence and the proposed change before release.
Connect the measurement stack
Process Street has direct, universal integrations to 5,000+ systems. Need a new one? An AI agent builds it on the fly. The workflow can receive an analytics alert, create implementation work, update the form record, and send the result to the system that owns the business outcome.
Verify the end asset
After release, confirm the live form, analytics events, stored response, and downstream action. An integrated form process is only healthy when the response reaches the intended system and creates the intended work.
Build a reusable operating loop
Use a recurring website user experience audit, marketing performance review, data quality audit, and change management process as starting points. Adapt the fields and controls to the form’s actual risk and outcome.
FAQs
What is form analytics?
Form analytics measures how people view, start, complete, abandon, and submit a form, then connects those behaviors to data quality and downstream outcomes. It combines funnel metrics, field-level events, behavior evidence, response data, and workflow results.
Which form analytics metrics should you track?
Track meaningful form views, starts, start rate, successful submissions, completion rate, abandonment, validation errors, field hesitation, completion time, valid outcome rate, and operational follow-through. Choose metrics that support a decision rather than collecting every available event.
How do you calculate form conversion rate?
Divide successful form submissions by meaningful form views, then multiply by 100. Also calculate completion rate by dividing successful submissions by form starts so you can separate pre-start hesitation from friction after entry begins.
How do you find where users abandon a form?
Use step and field events to identify the last interaction, error, or hesitation before exit. Then segment the pattern and review behavior evidence or user feedback. The last field touched is a clue, so confirm the cause with additional evidence or a controlled test.
What is field-level form analytics?
Field-level form analytics measures focus, completion, correction, validation errors, hesitation, and drop-off around individual fields. It helps locate friction, but it should avoid collecting the actual sensitive value entered by the user.
How does Process Street help improve forms?
Process Street turns a form analytics finding into assigned and governed work. Teams can capture evidence, route by impact, collect approvals, run integrations, verify the live result, and preserve an audit history of the improvement.