
Turn every policy into automated workflows with built-in enforcement and audit-ready proof.
Log Management Tools
Log management tools collect, process, search, and retain the event records produced by applications, servers, networks, cloud services, and security systems. They help teams move from scattered machine data to a searchable trail of what happened, when it happened, and what needs attention next.
The best log management tools do more than store logs. They help you control ingestion, parse raw events, query data fast, detect patterns, trigger alerts, and preserve evidence for troubleshooting, incident response, and compliance review.
This guide compares six strong log management tools: Datadog Log Management, Splunk Enterprise, Elastic Observability, Graylog, Sumo Logic, and New Relic Logs. It also shows where Process Street fits after an alert fires, turning technical signals into assigned, approved, auditable response workflows.
Log management tools at a glance
The short version: choose Datadog when logs need to sit close to cloud observability and incident work, Splunk when your team needs deep machine-data search across a large environment, Elastic when search flexibility matters, Graylog when centralized log management and security triage need to stay lean, Sumo Logic when cloud log analytics and live streams are central, and New Relic when you want logs inside a broader observability workspace.
Use the table for shortlist fit, then read the tool sections for the tradeoffs that matter in production: ingestion control, query experience, retention model, security workflow, and how cleanly alerts become real follow-up work.
| Tool | Best for | Standout feature | Pricing |
|---|---|---|---|
| Datadog Log Management | Cloud-native teams that want logs close to metrics, traces, and incidents | Pipeline, indexing, archive, and rehydration controls | Committed log volume with paid overage pricing |
| Splunk Enterprise | Large teams that need broad machine-data search and analytics | Search, analysis, visualization, and action across many data sources | Depends on Splunk product, package, deployment, and usage model |
| Elastic Observability | Teams that want search-first log exploration and flexible deployment | Log monitoring with parsing, routing, filtering, aggregation, and pattern analysis | Elastic Cloud and subscription pricing |
| Graylog | Lean IT and security teams that need centralized log management with SIEM options | Centralized log management, SIEM, Enterprise, and Open editions | Open and commercial editions, with pricing through Graylog |
| Sumo Logic | Cloud and security teams that want streaming logs, search, and analytics | Live Tail, ingest budgets, lookup tables, APIs, and log analytics operators | Sumo Credit tiers and flex packaging |
| New Relic Logs | Teams that want logs in one observability platform | Logs connected to telemetry, service context, and platform-wide troubleshooting | Free monthly data ingest allowance with paid ingest and user or compute pricing |
In this article, we are going to cover:
- Log management tools at a glance
- What are log management tools?
- Datadog Log Management
- Splunk Enterprise
- Elastic Observability
- Graylog
- Sumo Logic
- New Relic Logs
- How to choose log management tools
- How Process Street operationalizes log alerts
- FAQs
What are log management tools?
Log management tools are software platforms that gather log data from many systems and make it usable. A log can record a login attempt, an API error, a database timeout, a failed payment, a changed configuration, a suspicious network event, or a successful background job. By itself, one log line is small. Across a production environment, logs become one of the richest sources of operational evidence you have.
A capable log management platform usually covers six jobs. It collects data from agents, collectors, APIs, cloud services, and applications. It parses raw text into structured fields. It indexes the data you need to search quickly. It stores or archives less urgent data for later review. It alerts teams when patterns indicate risk or failure. It gives engineers, security analysts, and operations leaders a shared place to investigate.
That makes log management different from simple log storage. Storage only keeps the record. Management makes the record searchable, governed, and actionable. Log monitoring is the real-time layer that watches those records for events that need attention. Log analytics is the analysis layer that helps teams identify patterns, trends, and root causes.
The operational problem starts after the tool finds something. A log platform can tell you that an error spike happened. It may even show the likely service, user segment, or trace path. The team still needs a controlled response: classify the incident, assign an owner, preserve evidence, notify stakeholders, approve remediation, close the loop, and update the procedure. That is why teams often pair log platforms with an incident management process, an incident management report, and a repeatable runbook automation practice.
Datadog Log Management
Best for: cloud-native engineering teams that already use observability data to debug services and coordinate incidents.
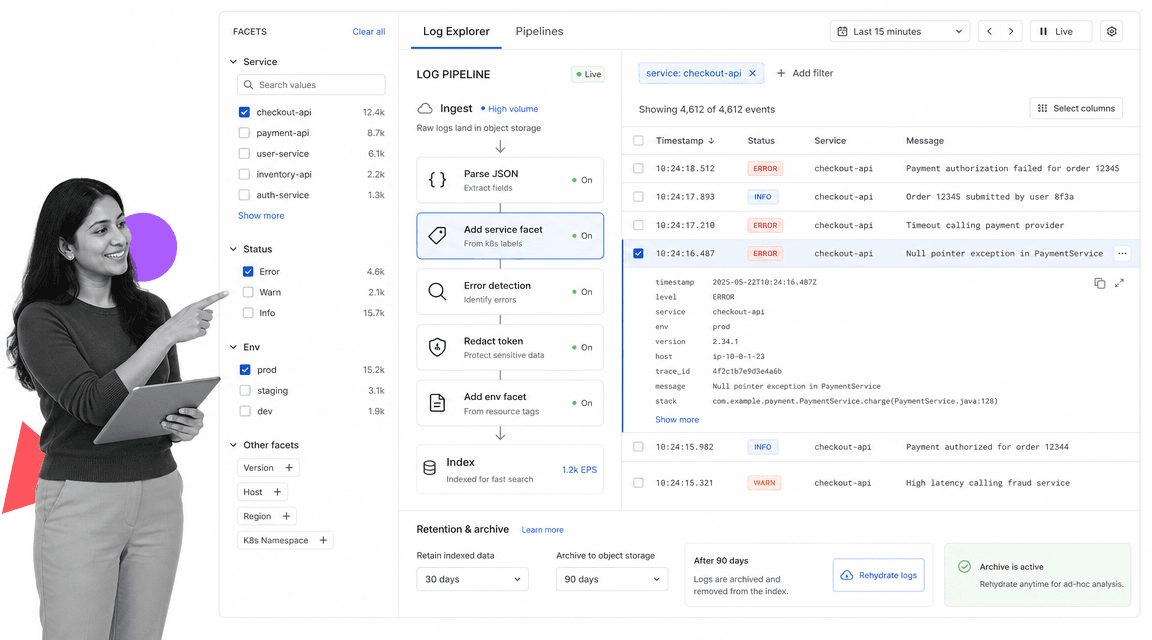
Datadog Log Management is strongest when logs need to sit beside metrics, traces, monitors, and incident context. Datadog’s log configuration docs describe controls for processing logs with pipelines and processors, generating metrics from ingested logs, setting indexes, forwarding archives, rehydrating archived logs, and restricting access. That makes it a good fit for teams that want to tune what gets indexed instead of treating every event the same way.
The main buying question is cost control. Datadog’s pricing page describes committed log volume and overage handling, so teams should model expected ingest, indexing, retention, and archive behavior before rolling it out broadly. Datadog can be efficient when teams actively manage pipelines and indexes. It can become expensive when every service emits noisy logs and no one owns routing rules.
- Choose Datadog when your alert response already starts in Datadog monitors, dashboards, or incidents.
- Watch for runaway log volume, duplicate attributes, and indexing rules no one reviews.
- Pair it with an incident management plan so high-priority alerts become assigned work, not just channel noise.
Splunk Enterprise

Best for: large organizations that need flexible search and analytics across many machine-data sources.
Splunk Enterprise is built around broad data access, search, analysis, visualization, and action. Splunk positions the platform as a way to explore data across environments, create dashboards, monitor operations, and make decisions from machine data. It is especially relevant when logs are not just an engineering signal, but also feed security operations, service management, fraud review, audit support, and executive reporting.
Splunk’s strength is also its implementation burden. Teams get power from search language, data models, indexes, dashboards, and apps, but those need ownership. If your organization has a mature security operations center, data engineering support, or a platform team that can govern fields and searches, Splunk can become a central investigation layer. If your team is small and wants a narrow log viewer, it may be more platform than you need.
Pricing depends on product, packaging, deployment, and usage model, so treat the Splunk pricing page as the starting point for a formal estimate. The practical selection question is not only cost. It is whether the organization can maintain the searches, dashboards, and response procedures that make Splunk valuable.
- Choose Splunk when machine-data search needs to serve engineering, IT, security, and operations.
- Make someone accountable for search governance, dashboard hygiene, and field standards.
- Connect serious incidents to service level agreement metrics so response quality is measured, not assumed.
Elastic Observability
Best for: teams that want search-first log exploration, structured fields, and deployment flexibility.
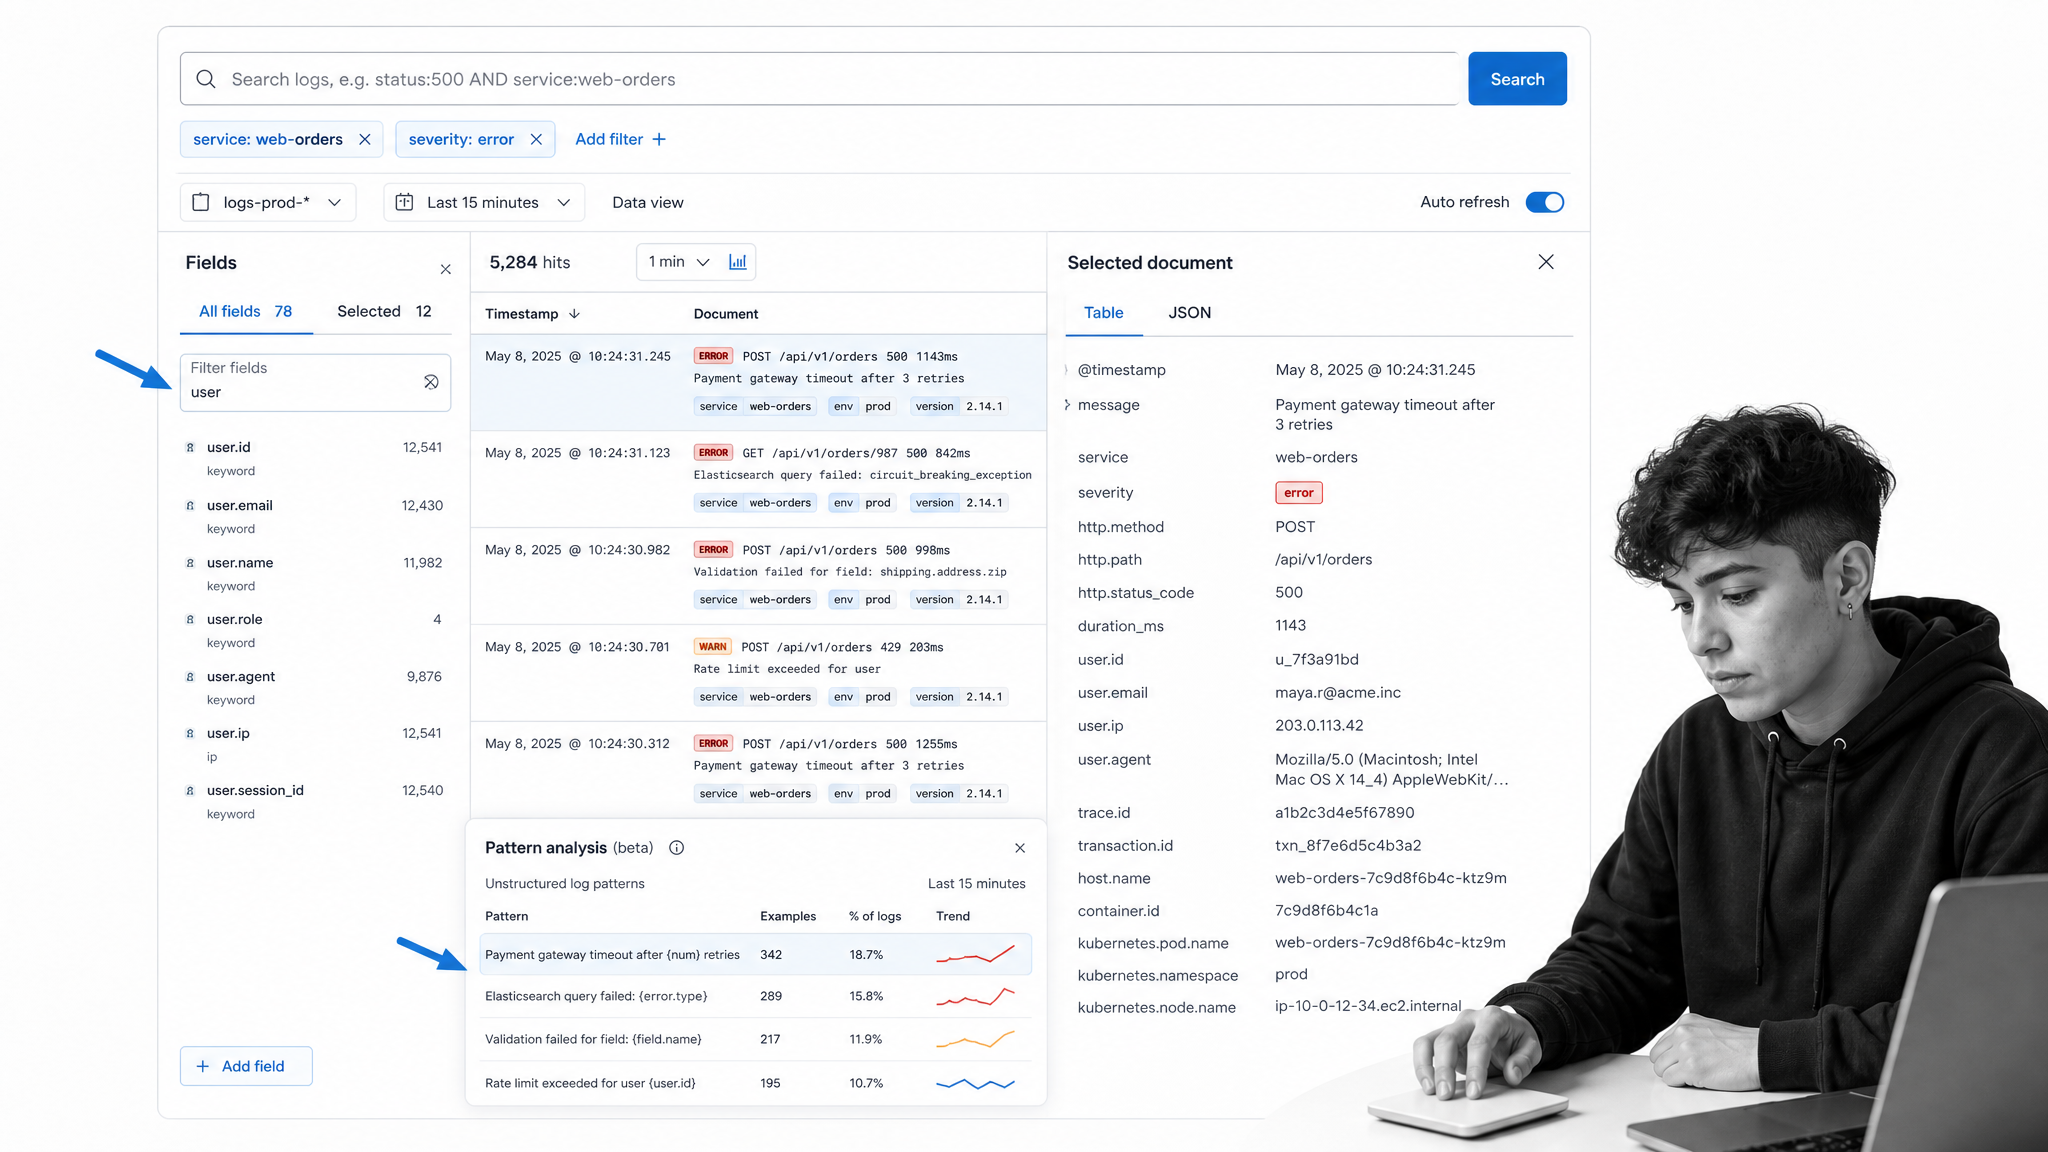
Elastic Observability log monitoring is a natural fit for teams that think in search. Elastic’s docs cover onboarding system logs, streaming any log file through Elastic Agent, parsing and routing logs, filtering and aggregating data, exploring logs, and running pattern analysis. That mix supports teams that need detailed field control and fast exploration across noisy systems.
Elastic often appeals to teams with technical operators who are comfortable tuning schemas, fields, indices, and query experiences. It can work well when you want a flexible stack and the ability to shape the logging system around your environment. The tradeoff is that flexibility needs discipline. Naming conventions, field mapping, retention, and index lifecycle choices all affect how useful the system feels six months later.
Use Elastic when search depth and data modeling matter more than a fully packaged workflow. If your logs support regulated operations, tie the investigation path to a controlled review process. For example, a failed production change might trigger a server check, then a server maintenance checklist, then a post-incident review that captures evidence and approvals.
Graylog

Best for: lean IT and security teams that need centralized log management with security triage options.
Graylog positions itself around centralized log management and SIEM for teams that want faster insight, lower cost, and visibility across the environment. Its site lays out Security, Enterprise, and Open editions, which makes it relevant for teams that want to start with centralized logging and grow toward security operations without adopting a heavier enterprise suite immediately.
Graylog is a strong shortlist option when your team needs practical log collection, streams, alerts, dashboards, and investigation without turning the logging project into a full data platform program. It can also be attractive when a team wants an open option as part of the evaluation. The selection risk is underestimating governance. A lean tool still needs source onboarding, parsing standards, retention rules, alert ownership, and review cadence.
- Choose Graylog when centralized visibility and security event triage matter more than broad observability suite coverage.
- Define who reviews streams, who owns alerts, and how evidence is preserved.
- Use server security checklist guidance to make log findings part of routine hardening, not only emergency response.
Sumo Logic

Best for: cloud and security teams that want log search, live streaming, analytics, and packaged operational capabilities.
Sumo Logic publishes a pricing and packaging page that also lists important platform capabilities: Live Tail for streaming logs, log search and visualizations, ingest budgets, lookup tables, management APIs, PCI apps and dashboards, predictive analytics, and operators such as LogReduce, LogCompare, and LogExplain. Those capabilities make Sumo Logic useful when teams need to move quickly from raw logs to patterns and operational insight.
The best fit is a team that cares about both security and reliability signals in cloud environments. Live streams help during active troubleshooting. Analytics and lookup enrichment help when recurring patterns matter more than one-off event search. Ingest budgets can also support cost ownership by making log volume a managed operational concern.
Sumo Logic’s Sumo Credit tiers and flex packaging should be modeled against expected daily ingest, search behavior, and retention. If your organization has many teams sending logs, define an intake policy before adoption: which logs are mandatory, which are sampled, which are archived, and which alerts must launch a controlled workflow.
New Relic Logs

Best for: teams that want logs inside a broader observability platform instead of operating a separate log tool.
New Relic Logs is designed for contextualized log monitoring and analysis inside New Relic’s observability platform. New Relic’s product page emphasizes connecting logs with telemetry and infrastructure data in one place. Its pricing page describes platform access that includes log management along with capabilities such as APM, infrastructure monitoring, digital experience monitoring, AIOps, and more.
New Relic is a strong option when your team wants fewer tools and a simpler path from a log pattern to a service, trace, application, or alert. The vendor also publishes a free monthly data ingest allowance and paid ingest model, which makes it easier to estimate early usage than tools that require a sales conversation before any directional model is possible.
The tradeoff is breadth. An all-in-one platform is useful when teams agree to work in the same observability surface. It can be less effective when security, operations, and engineering teams each want independent data models and workflows. If you choose New Relic, define how log findings become owner-assigned action items, especially for compliance or customer-impacting events.
How to choose log management tools
Start with the work the tool must support, not the feature checklist. A developer debugging a single service needs a different experience than a security analyst hunting across authentication logs, and both need a different system than an audit leader preserving evidence for review.
Know your log sources. List every source before choosing a platform: application logs, server logs, Kubernetes events, cloud provider logs, identity logs, firewall logs, database logs, CI/CD logs, and third-party SaaS logs. The wider the source set, the more important parsing, normalization, access control, and retention become.
Separate ingest from index. Many teams overpay because they treat every log as equally urgent. In reality, some events need fast search, some need low-cost archive, and some should be dropped or sampled. Look for controls that let you route, transform, index, archive, and rehydrate logs intentionally.
Test the query experience. Give the same investigation to each finalist. Ask an engineer to find a service error, a security analyst to trace suspicious authentication activity, and an operations lead to summarize the timeline. A tool that looks strong in a demo can feel slow if the query language, fields, or interface do not match how your team thinks.
Define alert ownership. Alerts fail when they only create messages. Every serious alert needs an owner, severity, service, deadline, escalation path, evidence record, and closeout step. That is where workflow automation compliance matters: the response itself needs a record, not only the event that triggered it.
Connect logs to audit evidence. For regulated teams, the log is only one piece of proof. You also need to show who reviewed it, what they decided, which corrective action was approved, and when the issue closed. If that matters in your environment, compare log tools alongside audit management software, compliance management software, and the response workflows that connect them.
How Process Street operationalizes log alerts
Log platforms are excellent at detection and investigation. They are not always the best place to enforce the human and procedural work that follows. When a high-severity event appears, the work often crosses engineering, IT, security, legal, customer success, and leadership. That work needs structure.
Process Street turns the response into a controlled workflow. A log alert can trigger an incident run. The run can classify severity, assign owners, collect screenshots or exported log evidence, route an approval, notify stakeholders, enforce a remediation checklist, and require a post-incident review before closure. That makes the alert operationally complete.
This is where log management and workflow automation work together. The log tool answers what happened. The workflow answers who is responsible, what must happen next, and where the proof lives. Teams evaluating workflow automation tools or workflow automation software should look for evidence capture, approvals, due dates, conditional paths, and reporting that can support log-driven response work.
The best operating model is simple: let the log management tool own telemetry, search, and alerting. Let the workflow layer own response, accountability, approval, and proof. That keeps engineers inside the tools they need while giving operations and compliance leaders a clean record of what was done.
FAQs
What are log management tools?
Log management tools collect, parse, store, search, and analyze log data from applications, servers, cloud services, networks, and security systems. They help teams troubleshoot incidents, monitor system behavior, preserve evidence, and identify patterns across large volumes of machine data.
What is the difference between log management and log monitoring?
Log management is the full system for collecting, processing, retaining, and searching logs. Log monitoring is the real-time watch layer that detects patterns, errors, or threshold breaches and triggers alerts. Monitoring depends on good management because alerts are only useful when the underlying logs are clean, searchable, and trusted.
Which log management tool is best for small teams?
Small teams usually need fast setup, predictable cost controls, and a query experience that does not require a dedicated platform owner. Graylog, New Relic, Datadog, and Elastic can all fit depending on whether the team values open options, all-in-one observability, cloud telemetry, or search flexibility most.
What should I look for in log management software?
Look for source coverage, ingestion controls, parsing and normalization, search speed, retention and archive options, access control, alerting, dashboards, cost controls, and integrations with incident response workflows. The right tool should fit how your team investigates problems and how your organization proves follow-up work was completed.
How do log management tools support compliance?
Log management tools support compliance by preserving event records, restricting access, helping teams investigate suspicious activity, and creating searchable evidence. They become stronger when paired with workflows that document review, approval, remediation, and closure, because auditors often need proof of action, not only proof that an event occurred.
