
How do you know that your audience likes what you’re doing? Are they interested in what you’re saying and getting involved in the ways that you want them to be?
To know that, you need to be tracking your audience engagement. To help you do that, we here at Process Street have broken down the what, how, and why of audience engagement in this post.
This post will show you:
- What audience engagement is (without the jargon)
- Why it matters
- The 8 elements to track and assess it
- How SEO can damage your engagement
Whether you want to know why your traffic is healthy but your products aren’t selling or you just want to know how to improve your current operations and get more value out of your efforts, this is the post for you.
Let’s begin.
Audience engagement basics
What audience engagement is

Audience engagement is a blanket term for:
- How interested your audience is with your content
- How much they “take part” in your content (via reading, watching, commenting, etc)
That’s it. No fancy tricks. It’s a measure of how active your audience is with what you produce but usually with a positive emotional implication too.
It’s also something which is vague enough to be commonly thought of as meaningless. This is because there aren’t measurable metrics which apply to all forms of audience engagement.
You can measure audience engagement. You can’t sum up how to do it in every situation in a single post.
Different meanings for different purposes
“Audience engagement” means different things to different people because of the unique ways in which the audience will interact with various businesses.
For example, let’s say you’re trying to build a blog. A perfect example of an engaged audience member (let’s call her Dee) would read your posts, comment where appropriate and add to the discussion, share your content after reading it, move between several posts in each session, and so on.
It’s hard to describe without saying “engaged” but Dee is interested and interacting with your content, liking it so much that she’s providing extra value by herself.

In contrast, if Dee were to attend a stand-up comedy gig she would be “engaged” by laughing at the jokes, clapping where appropriate (without prompting) and maybe even volunteering should the need arise. She’s still a template for audience engagement, it’s just that the criteria for the title have changed.
In this way, elements relevant to how your audience interacts with your business must be identified to let you measure your own engagement levels.
Why engagement matters
Audience engagement is a vital success metric for any business looking to attract a large audience. It shows the “health” of your audience by giving you enough information to see how much they enjoy what you’re producing.
Sticking with our example, Dee is loving what you’re doing. She reads every post, gets other readers chatting in the comments, and is the model of what you’d love out of your audience. She’s probably going to stick around and interact further, creating more value.
Except the only way you’re going to know that is to measure audience engagement. Without that, you won’t know how many people like what you’re doing, have ideas on why they like it, and how to improve it further to get more positive attention.
It’s also a great metric for showing how resilient your content is to changes in Google’s search engine ranking formula.
If your engagement is low but blog post traffic is high, the implication is that what you’re making is good at gaming the current SEO formula but not so good at giving the audience what they actually need. You’ll also suffer from fewer return visitors due to the lack of solid interest.
Meanwhile, high audience engagement means that people like your stuff enough to spend some time with it and interact further. This won’t go away with a tweak to Google’s search engine and (since Google likes pages that audiences do) makes your content “stickier” in search engine rankings.
8 audience engagement elements

To keep things simple, let’s break down audience engagement into concrete metrics you can measure. Obviously, these metrics (and their importance) will change based on what business you’re running and what you want your audience to do, so we’ll keep it to one situation.
I’ll stick to the elements for analyzing a blog’s engagement since I doubt many of you are running a stand-up show and looking for tips.
The short list is:
- Session duration
- Bounce rate
- Average time on page
- Number of pages per session
- Returning vs. new visitors
- Shares from article pages (not general shares)
- Active engagement amount (scroll depth & click location)
Unless stated otherwise these elements can be easily tracked through a default view in Google Analytics but I’ll cover some tips on measuring and interpreting each as we go. I’ll also provide tips on how to measure those which GA can’t handle natively.
Session duration
Session duration is the amount of time that each audience “session” lasts. This gives you a rough handle on how long your audience is spending on your site in one sitting, which is a pretty decent way of judging either how valuable your site is to them or how good it is at holding their attention.
To clarify, in Google Analytics a “session” means:
“… a group of user interactions with your website that take place within a given time frame. For example a single session can contain multiple page views, events, social interactions, and ecommerce transactions.” – How a web session is defined in Analytics
By default, the time frame for a single session is 30 minutes, although a session is also ended if the user navigates away from your site (or closes the tab) and if a new calendar day begins while they are browsing. If they resume activity after 30 minutes (or navigate back to your site) this counts as a new session.
Basically, the longer your average session duration, the more engaged they are with your content and site. If, however, your site has a number of short articles or users don’t have to spend long on your site to get its main value (eg, downloading a free ebook and then going offline).
Bounce rate
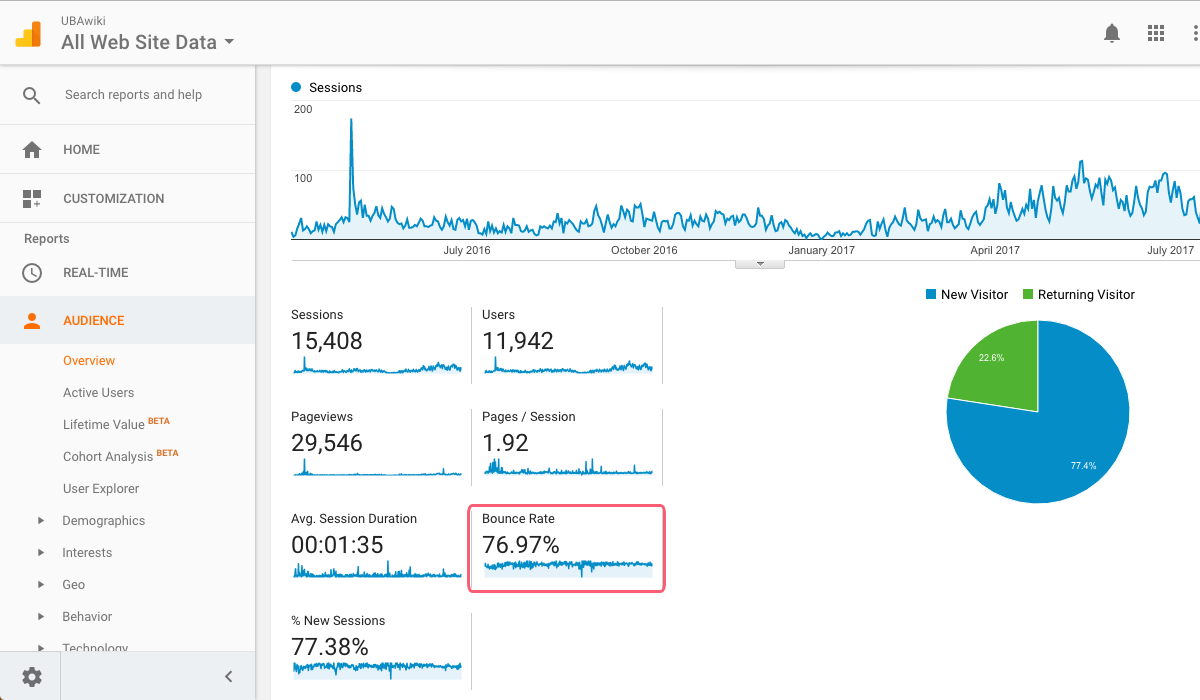
Bounce rate is the % of people who open a page of your website and then leave without viewing any other pages. It doesn’t tell you how long they spent on that page, how much they saw of it or even what value they got or generated from doing so.
This is key. Don’t get stuck thinking that bounce rate is the only business metric that matters.
Don’t get me wrong – your bounce rate is important. It’s just not the end-all statistic to seeing whether your audience is engaged with your content.
The average bounce rate also varies between the type of page and website. For example, blog sites commonly have an average bounce rate of 70-90% (because people read one post, then go somewhere else) whereas service sites hover around 10-30% (with users searching for a product, reading reviews, adding to their cart, etc).
Having a lower bounce rate is good for pretty much any website but it pays to be aware of the average for your industry and react appropriately.
Take your industry’s average, compare it to how vital it is for your audience to click through to other pages in the same session, then get your final impression on whether your content is interesting and engaging enough for them to want to stick around.
Average time on page

This one’s self-explanatory – it’s is the amount of time that someone spends on a given page. Much like bounce rate and session time it’s not foolproof but, along with the other metrics here, it provides a more whole picture of how your audience is interacting with your work.
The time itself will, again, vary depending on your industry, the type of page, what the page’s purpose is (a “thank you” page will be viewed for less time than a “complete guide”) and so on. This is why the average page time itself isn’t useful on its own – there are too many influential factors to get a sense of the reason behind it.
Nevertheless, it’s worth checking this figure. Even if it’s slightly out due to odd results, a vague idea of how long your audience spends on a page (and therefore hopefully engages with the content) is better than no idea at all.
The trick is to combine it with figures such as the session duration, pages per session, and level of active engagement (more on that shortly).
Number of pages per session
Another easy figure to understand, the average number of pages per session shows how many of your pages a user viewed in a single session. Remember that a session is any period of time from when they arrive on your site until they leave or spend 30 minutes inactive (or the date changes).
This one’s easy to see the value of – the more pages a person views before closing your site, the more interested in your content or offers they likely were.
There’s once again very little in the way of an average figure for this, so try to put it into the perspective of how many pages you need (or would like) your audience to realistically visit. For example, a blog with long-form content may only expect one or two pageviews per session, whereas a shopfront would likely want double or triple that number.
Returning vs new visitors
One great way of showing the relative health of your audience acquisition and retention process in action is to check out the number of returning visitors vs new ones. “New” visitors are people who haven’t been to your site within the last two years, whereas returning visitors have.
Again, there are no set guidelines for these figures as they will depend largely on the nature and goals of your site. A blog will want to have a solid base of returning visitors along with a healthy dose of new too whereas, say, a lawn-laying business or another “brochure website” is probably going to have very few returning customers.
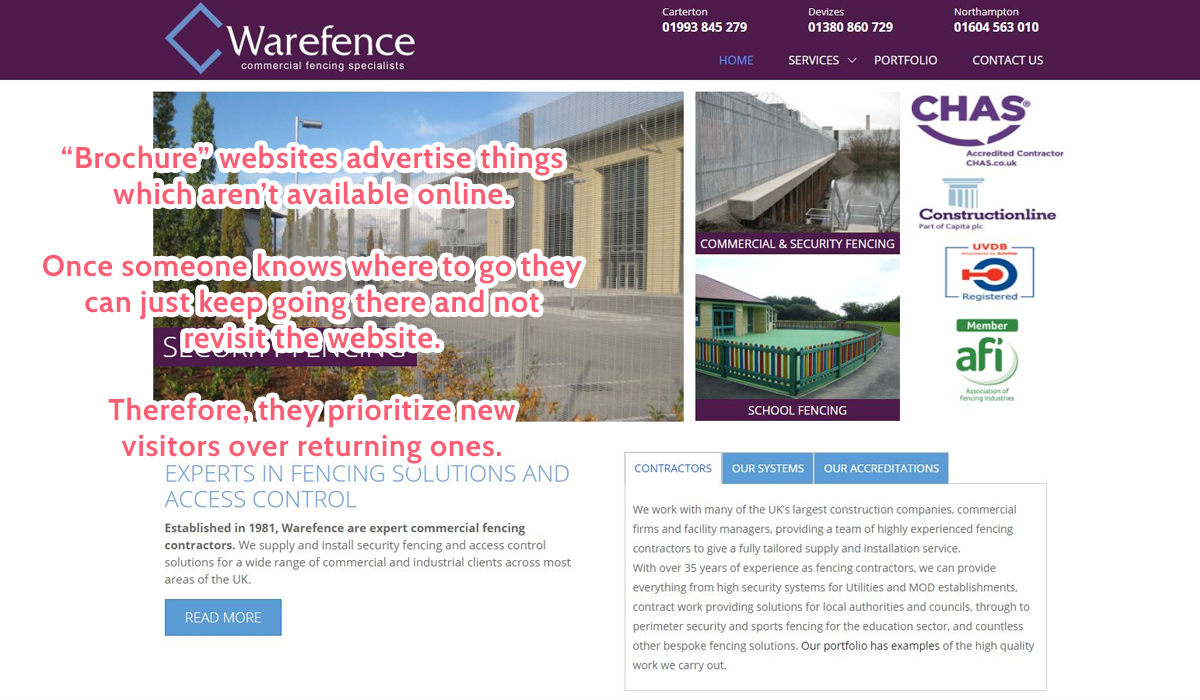
In general, the more returning visitors you have, the more engaging your content or services are. As long as you also have a steady influx of new visitors to grow your audience in total, you should be golden.
Shares from article pages
There’s an important distinction here. Tracking the general number of shares is great for measuring your reach but not so much for seeing your level of audience engagement.
Instead, you need to track the number of shares received from article pages. As in “the number of shares from users viewing your website at the time”.
This involves tracking your website’s share buttons, be they set up using a WordPress plugin or through a service such as Sumo.
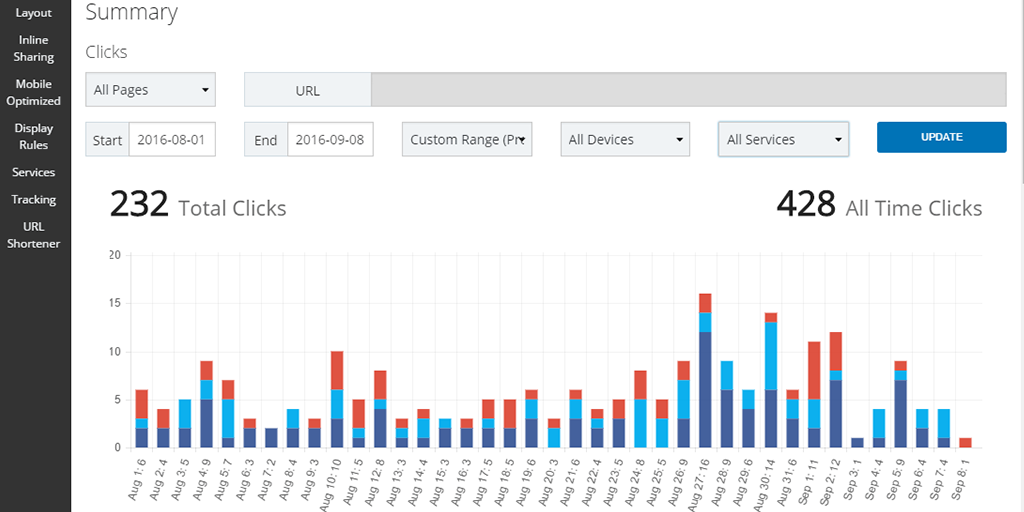
This will show you how well your content is going down with the people who actually read it – these shares don’t count people who see a post on social media and share it without viewing the page.
Active engagement amount (scroll depth & click location)
You can’t trust figures like session duration alone – someone could leave your page open and leave their computer to, say, grab a coffee. They’re staying longer on a page but not actually engaging with your content or getting much out of it.
This is a problem because (as I’ll show soon) passive engagement is a flimsy platform to place your page’s success on. Getting someone interested in the content and reading the whole thing or interacting with clickable elements means that they’re more likely to come back again and take further action.
Conversely, if you check your site ranking and notice that you’re ranking highly and getting a lot of traffic but your content is only useful enough to warrant a quick glance, you’re just sitting in a glass house. All someone has to do is throw a stone to knock you off the top spot.
So, outside of Google Analytics, you’ll need to find a way to track figures such as scroll depth and visitor click locations. Scroll depth being how far someone scrolls through a given page and the click locations being…. well, where a visitor clicks on the page.

Sumo is great for this – their Heat Maps tool shows where the majority of click on your pages are while. Scroll depth can be tracked using this plugin for Google Analytics by Rob Flaherty.
If you notice that people are spending a lot of time on a page without scrolling, chances are that they’re dead views. If most visitors scroll to a certain point before navigating away, this might be a section you can optimize to encourage further reading.
A combined view of audience engagement
After assessing and combining the view of each element you can then judge how involved they are with your content. While there’s no set unit of measurement for audience engagement, the combined view should provide enough insight to see how effective your site is at getting and keeping the attention of your audience.
You’ll also see roughly how successful you are in inspiring further action or interaction with your site’s other pages and features, along with the relative health of your audience.
For example, let’s say your traffic has been increasing at a steady pace but you want to know how to improve it. A quick look at your audience engagement could show a lack of returning visitors and a lower page-per-session count than you’d like. This tells you that you need to work on getting people back after their first visit and show them the value of going to a different part of your website (eg, through relevant content).
The solution won’t always be simple but it’s better to know where you stand and use that to test potential solutions than starting to fall apart and not knowing why.
SEO vs audience engagement
The final note to say on audience engagement is that it should never be a casualty to SEO research and technique. Optimizing for Google is important but optimizing for your audience will ensure lasting success.
You can’t tailor your site to cater to a formula and just expect your audience to like it. All that has to happen for your site to stop dead is a change in Google’s formula.
Take the Fred update, for example. This March 2017 Google update tackled the issue of sites generating backlinks through shady means and generally penalized those with thin or low-quality content. Any site which had prioritized SEO over audience engagement in this way took an instant dive in ranking and their organic traffic suffered heavily because of it.
Audience engagement is key to having a successful online presence. It might be hard to define as a general rule but SEO alone won’t win over a long-lasting audience.
How do you keep your audience interested and engaged? Let me know in the comments below!


 Workflows
 Projects
 Data Sets
 Forms
Forms Pages
Pages Automations
 Analytics
 Apps
Apps Integrations
 Property management
 Human resources
 Customer management
 Information technology


Ben Mulholland
Ben Mulholland is an Editor at Process Street, and winds down with a casual article or two on Mulholland Writing. Find him on Twitter here.