 Workflows
 Projects
 Data Sets
 Forms
Forms Pages
Pages Automations
 Analytics
 Apps
Apps Integrations
 Property management
 Human resources
 Customer management
 Information technology


Business Process Model & Notation (BPMN) is like a flow chart on steroids.
It’s the one true way to graphically map your processes and is a globally-recognized, standardized method. In other words, it’s information any business looking to draw reliable process maps needs to know.
When you map your processes (especially with a standardized method like BPMN), you start being able to:
- Get a clear vision of exactly how everything in your business works
- Save time by eliminating unnecessary tasks
- Reduce the rate your employees forget, overlook, or wrongly execute work
So, what exactly is it?
I compared it to a flow chart but much more than that: it has the functionality for representing things like information moving between teams, data being stored on the cloud, and departments working in parallel on the same process.
Although, at its simplest, a process map drawn with BPMN looks like this:
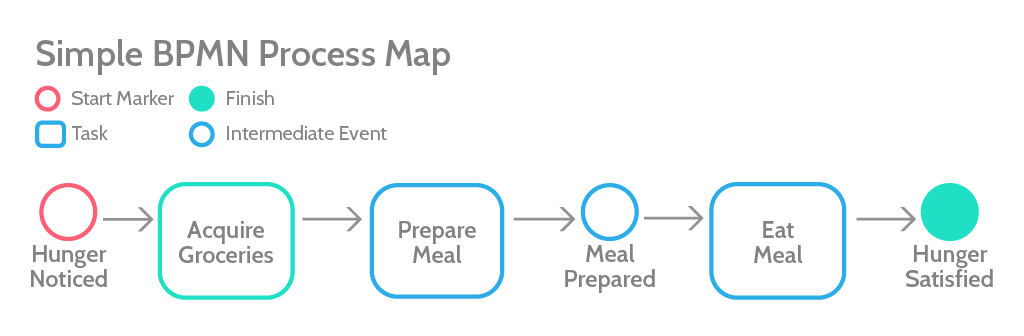
BPMN makes it easy to understand the flow without actually understanding the exact symbols because it’s a simple, intuitive method.
It has been under active development since 2004, and is now widely accepted as the way to draw process maps. That’s because:
- It’s simple and easy to understand at a glance
- It’s precise, with a wide range of symbols to cover every use case
- It’s designed to model both human-centric and IT processes with equal accuracy
The main scope of BPMN, as described by Trisotech:
“It provides businesses, with the capability of understanding their internal business procedures in a graphical notation, and gives organizations the ability to communicate these procedures, in a standard manner”
On the scope of this BPMN tutorial:
If you’re going to take a stab at mapping your business processes but don’t know where to start with transferring the rough notes and sketches into maps anyone can use, this is the article for you. It will get you acquainted with the basic concepts, and also give you references to deeper documentation you can use if you need it.
Overall, this guide will work as a standalone for the majority of uses cases startups and small businesses face.
The history of BPMN
Business Process Model and Notation was originally developed under another name in 2000 by the Business Process Management Initiative — a non-profit organization founded by industry BPM leaders from companies like Ernst & Young and Versata.
The aim was to standardize how processes were visually represented, and that aim has been carried on since 2004 by Object Management Group — a NFP technology standards consortium, snappily abbreviated as OMG.

As businesses change — and IT becomes more vital — OMG keep BPMN updated, and able to handle new kinds of processes. At the time of writing, we’re on BPMN 2.0, which defines more symbols and map types to represent the real ways modern organizations get work done.
Learning BPMN
Learning BPMN is similar to learning a programming language; while you can read overviews and short quick-start guides or watch video tutorials, the best thing you can do to get to grips is make sure you understand the basics, then start mapping out your business processes while reading the documentation whenever you’re not sure how to represent something.
Understanding lanes and pools
The canvas for a map drawn with BPMN consists of lanes and pools.
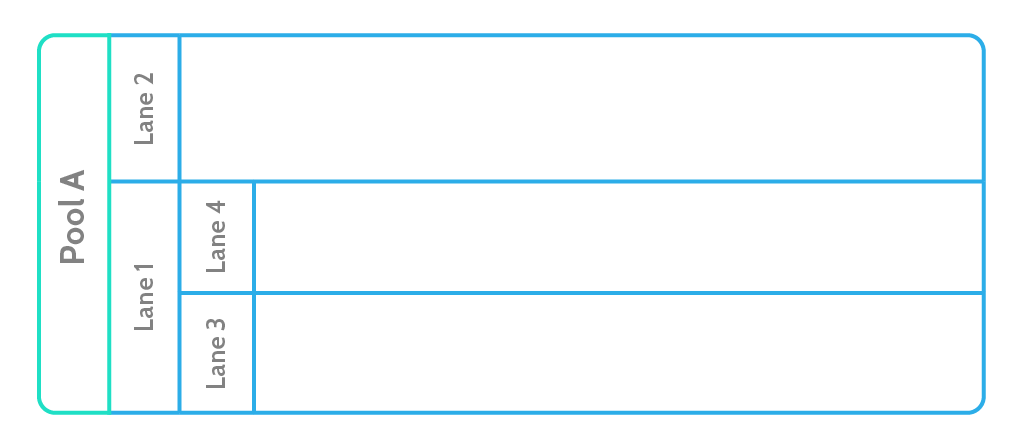
Pools represent different organizations or entirely separate processes. Lanes represent different teams or individuals within the same organization.
Pools
Pools are the biggest unit on a map: they’re the areas that contain lanes, events, tasks, etc. They represent who is doing the task. If we were to map our customer support process, there’d be one pool for Process Street and one pool for the customer. Work can flow between pools, signifying something like sending the customer a message.
The exact usage of pools and lanes can be a matter of taste. Whether you use separate pools to represent different departments in your company or just opt to use lanes, there are some hard and fast rules:
- Each pool can contain a maximum of one process
- Pools represent participants: companies, customers, or departments
Lanes
Often, processes need two or more departments to interact with each other. For example, a simple order fulfillment process might look like this:
- Customer places order over the telephone with credit card
- Order clerk charges credit card
- Clerk notes down SKU and customer details
- Clerk emails SKU and details to the warehouse
- Item is packaged up with label
- Shipping mail it to the customer
Or, in BPMN:
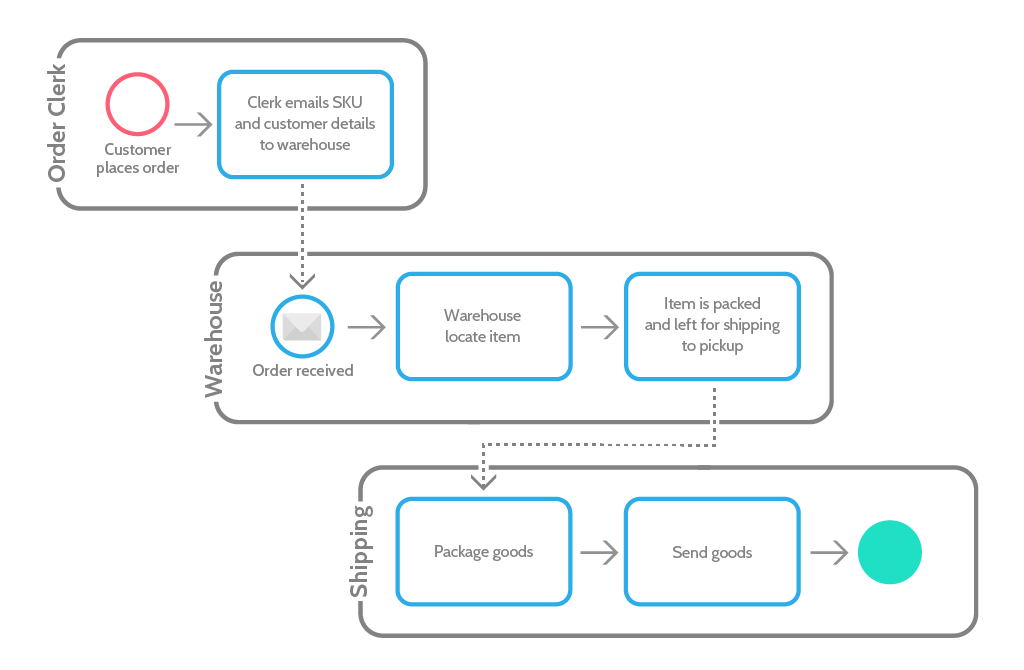
The main canvas (or pool) of a process map can be divided up into rows (or lanes). Each lane represents one parallel of the process, and shows both the exact tasks and responsibilities each department has, and the interplay between them.
Lanes don’t always mean departments or people. According to Camunda’s reference, they can be:
- Positions in the primary organization, for example, accounting clerk
- Roles in the secondary organization, for example, data protection officer
- General roles, for example, customer
- Departments, for example, sales
- IT applications, for example, CRM system
- Differentiating manual and automated steps
You’ll also notice some new shapes in the example above. The message shape signifies information transferred between two activities, and the shaded circle represents the end of the process.
Understanding basic notation
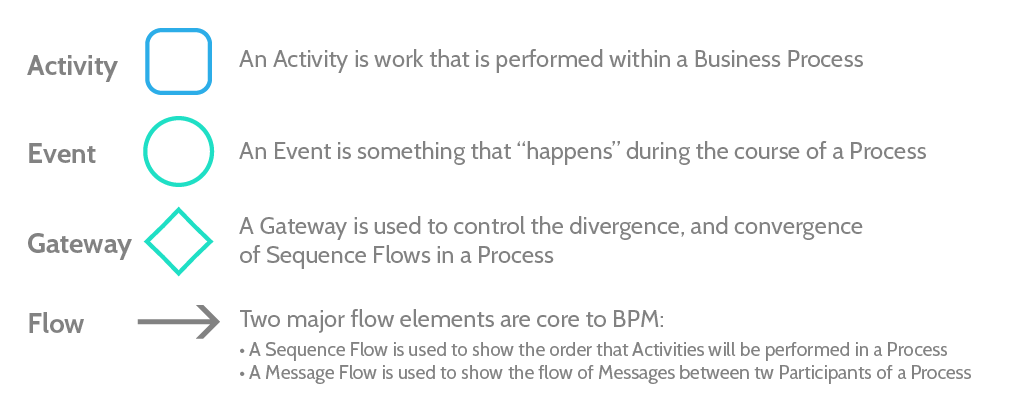
The basic shapes of BPMN are very similar to flow diagrams, but instead of representing pure logical stages, they can also represent business-specific actions, like messaging other departments, and escalating issues.
Activities represent tasks
Activities are simple for most purposes. Just a rectangle with rounded corners. They represent work to be done, like a checkbox on a checklist or an item on your todo list.
Connecting objects show associations and the flow of work/information
Since BPMN aims to show the flow of activities, it uses three different kinds of connecting objects that show how the activities are related to each other:
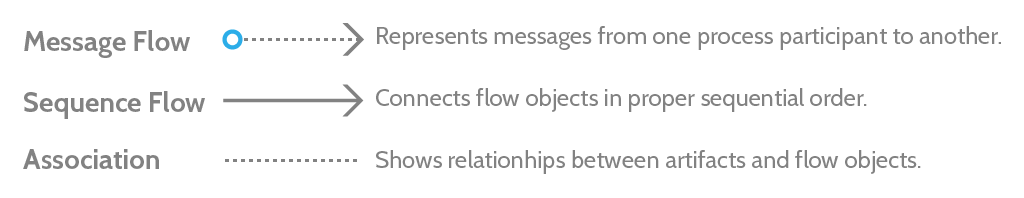
Sequence flow the basic line that connects together elements of your map. It shows the flow of work, and is necessary for connecting together activities. Without a sequence flow, your map is invalid.
Message flow is used when different departments or organizations send information between each other. Since you don’t get up and go and oversee the work in different departments when you want a task done, message flow represents a request or the sharing of information, not a strict action. It’s the only kind of flow that can take place between pools or lanes (organizations or departments).
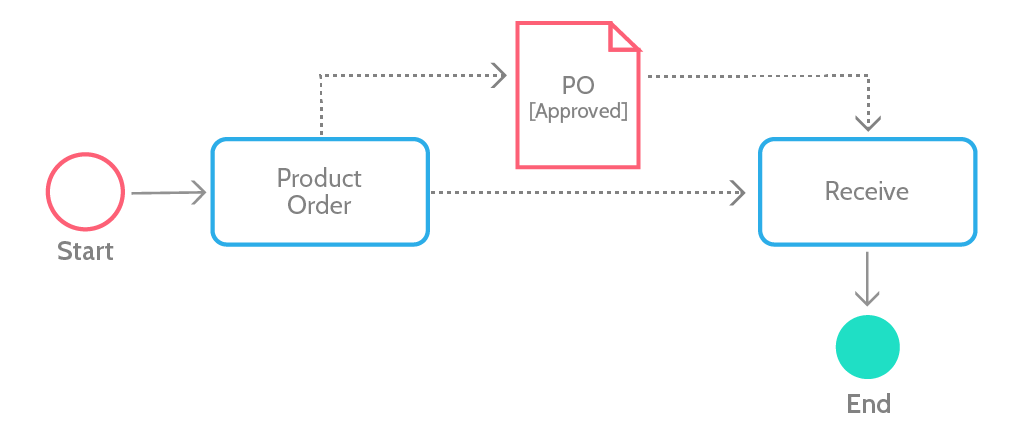
Association is used to tie documents, databases, and other artifacts together with activities. For example, if you had an activity to sign off on a purchase order, you’d use a document symbol and an association line to link the two together.
Gateways deal with logic/decisions
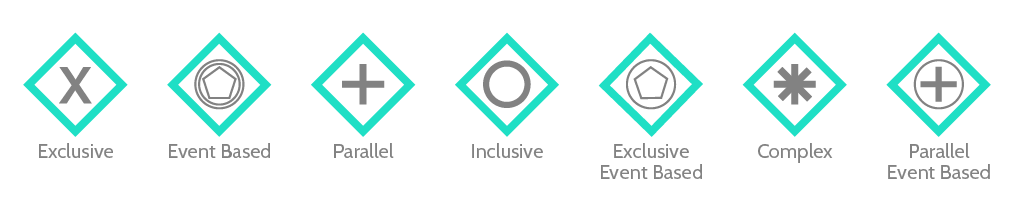
Similar to diamonds in regular flow charts, gateways represent a split or convergence in the process chart.
For example, when making a choice of what to eat, the process will split depending on the final meal choice, but will converge at the point where the meal is eaten, because no matter which meal is chosen, it will eventually be eaten.
Event Gateways
Not all gateways are choices, though. It could be that the continuation of the process depends on getting hold of more data, or waiting for a specific time, or meeting some other condition. In that case, it’s represented as an event gateway, and branches into whichever event takes place next.
For example, if you’re waiting for over a week for your delivery to come, you might reach a point where you decide whether to wait patiently, or call the shipping company. You’d have an event-based gateway at that point, branching into waiting more time, or into calling. Like this:
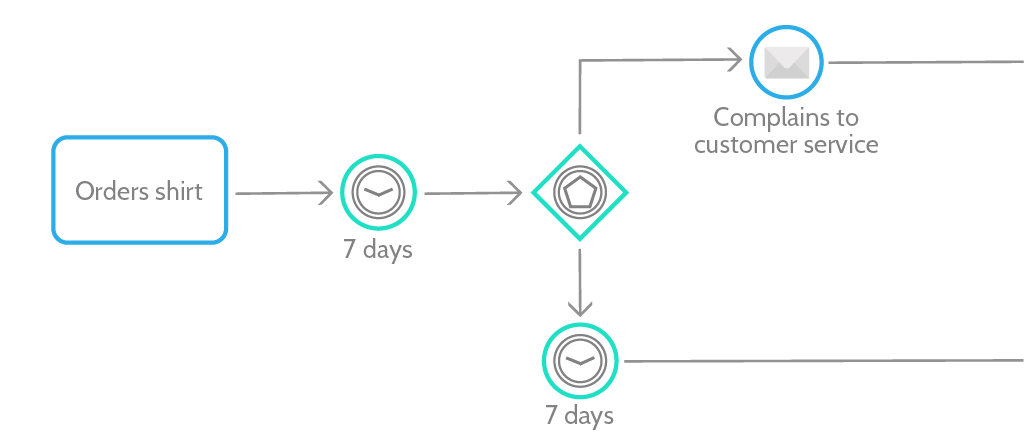
In the above diagram, take note of the time and message shapes — both very simple concepts that don’t need much elaboration!
- Time can either be days/hours/minutes or specific dates/years/quarters.
- Messages are any information directed by and to a specific recipient (individual, department, organization, etc.). It can be data, files, emails, phone calls, letters, etc.
Parallel Gateways
If a task isn’t dependent on another task, there’s no reason for them not to be done in parallel when the process begins. To represent this on a BPMN map, use a parallel gateway.
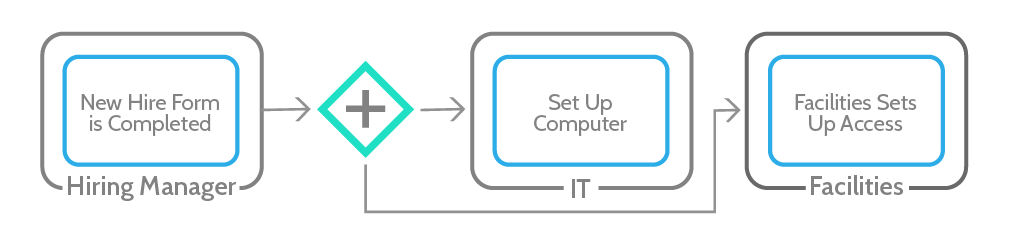
All that signifies is that there is now a chance for both subsequent tasks to be started: the process breaks down into two parallel branches.
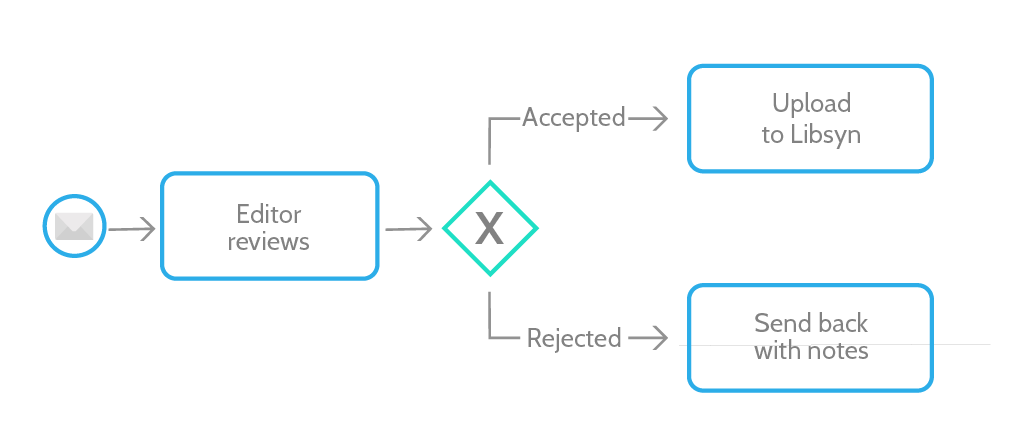
Exclusive Gateways
Sometimes, a process can go only one of two (or any number of) ways. For example, either the podcast recording is accepted and moves onto the editing stage, or it’s rejected and moves back to the editor for another pass.
That’s an example of when you would use an exclusive gateway — because there’s no third option. It looks like this:
Inclusive Gateways
An inclusive gateway breaks the process into multiple branches, with an explanation of which condition must be met for the flow to continue down that branch.
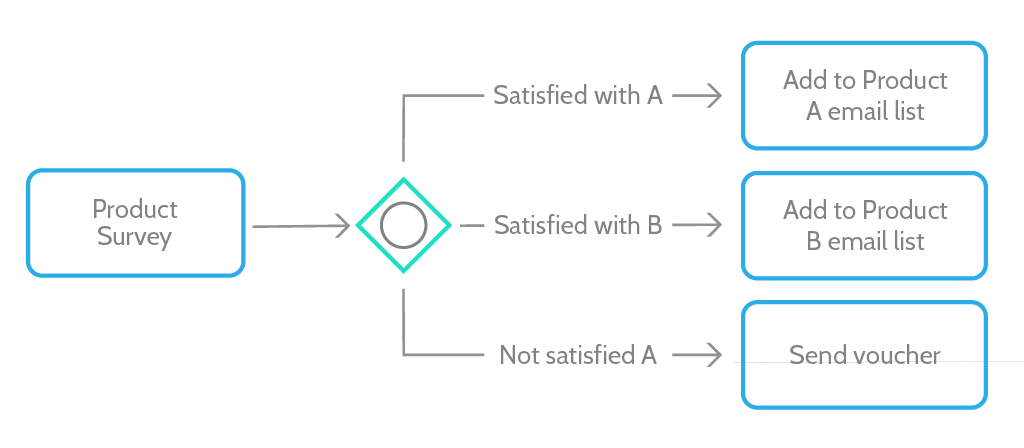
An example given by Lucidchart to explain a inclusive gateway is a process that forks based on a specific customer’s response to a survey. They explain:
“One process is triggered if the consumer is satisfied with product A. Another flow is triggered when the consumer indicates that they are satisfied with product B. A third process is triggered if they aren’t satisfied with A. There will be a minimal flow of one and a max of two.”
Inclusive gateways allow for multiple possible outcomes to be selected. For example, the customer could be both ‘not satisfied with A’ and ‘satisfied with B’, and in that case they’d be sent the voucher and also get added onto the B list.
An example of BPMN concepts in action
Here’s an example of a process map using the basic shapes, made with Draw.io:
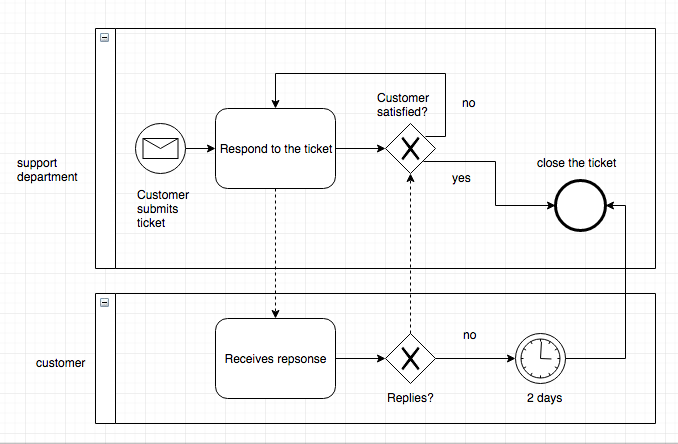
To explain, above we have two pools with one lane each. The process is started by the customer, who sends a ticket to your company’s support team. Support responds, and then waits two days. If the customer hasn’t replied, the ticket is closed. If the customer is satisfied, the ticket is closed. Otherwise, communication continues until one of those conditions is met.
It’s a massive oversimplification, but it’s a start, and a good way to illustrate the basic concepts.
Diagram tools that support BPMN
It’d be mad to use a pen and paper for technical drawing like this, so take your pick from the range of BPMN tools available:
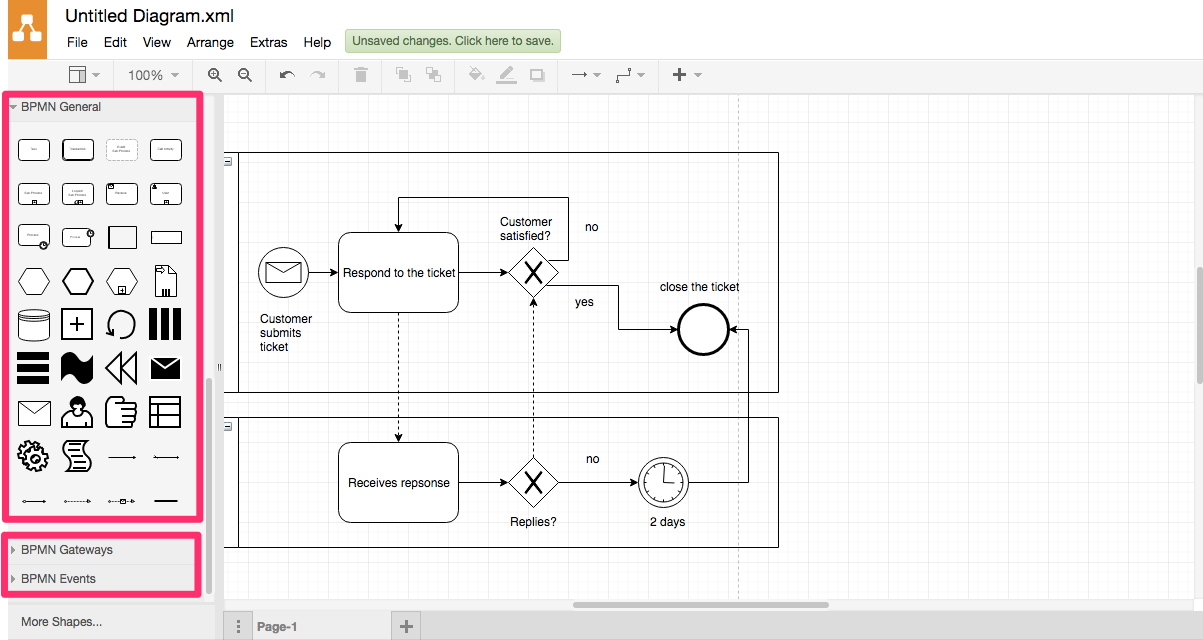
Draw.io [free]
Draw.io is an amazing tool, especially considering that it’s 100% free. You can pay for features like integrations and compliance, but overall the core software is free, supports every BPMN symbol, and makes it easy to create great process maps.
Microsoft Visio [$15.50/month]
Microsoft’s behemoth of a process mapping tool — Visio — is the industry standard that all other mapping tools wish they could take down. Just because it’s the most widely used doesn’t mean it’s the best; it’s widely used because it’s packaged with Office 365 and other Microsoft packages. It doesn’t integrate, it’s incompatible on Mac, and it’s the most expensive.
It is, however, easy to use and is the subject of a lot of helpful guides around the web.
Lucid Chart [starting at $4.95/month]
While Visio is quite a rigid product, Lucidchart allows for real time collaborative editing, chat, and comments. That can make process development in BPMN a collaborative activity, encouraging teams to work together and helping keep the process accurate with less margin for error.
SmartDraw [$14.95/month]
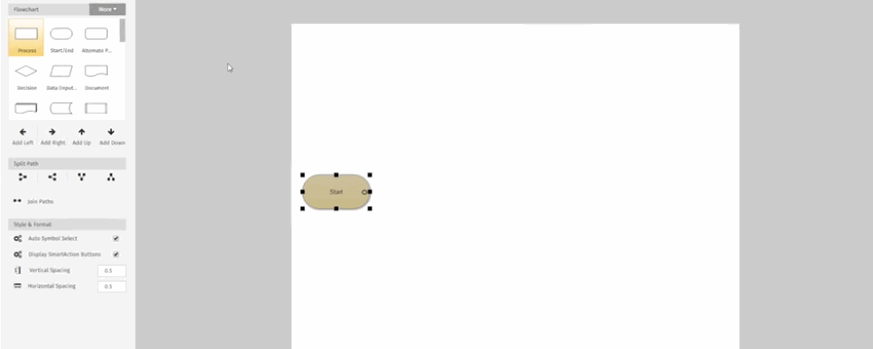
SmartDraw was designed with power users in mind, but that doesn’t mean it’s hard for new users to pick up. It groups its symbols in a similar way to Draw.io, meaning that all your BPMN symbols will be in one place, easy to access.
Additionally, it includes a method of quickly drawing flows that link together:
Implementing BPMN: your first step
The first step to implementing process maps using BPMN depends really on your starting point.
- If you have existing process maps, you could standardize them with BPMN
- If you have never mapped a process before, use this checklist to create one, and this checklist to optimize a process.
Follow this checklist for every process you choose to map:
As for implementing BPMN itself, just make sure to use a BPMN-compatible tool like the ones listed above, and refer back to the documentation if you need assurance.
To put these techniques into practice you’ll need more than just process maps. Process maps are good for overviewing a flow but they’re not going to be followed by your team. Check out the links below to read about the software you need for the use case you’re dealing with:
- Workflow software
- Business process management software
- Onboarding software
- Standard operating procedure software
I hope this guide has helped you better systemize your business, or learn a new skill you can use to effectively map processes 🙂
Benjamin Brandall
Benjamin Brandall is a content marketer at Process Street.