


Turn every policy into automated workflows with built-in enforcement and audit-ready proof.



Business Analysis Tools: A Complete Guide for Modern Teams
- What are business analysis tools?
- Why do business analysts still need dedicated tools?
- The business analysis toolkit, by category
- Which business analysis techniques do these tools support?
- How do you choose the right business analysis tool?
- What does AI-native business analysis look like?
- Where Process Street fits in the modern stack
- Business analysis tools FAQs
Business analysis turns messy operational reality into decisions people can act on. The right tools make that work faster, clearer, and easier to share. The wrong ones scatter requirements across email, slides, and spreadsheets until nobody trusts the picture.
This guide maps the business analysis tool landscape the way a working analyst actually uses it: by the job to be done. You will find the core categories, the strongest options in each, the analysis techniques these tools support, and a simple way to choose. The professional standard for the discipline is the BABOK Guide from the IIBA, and the categories below line up with how that body of knowledge frames the work.
What are business analysis tools?
Business analysis tools are the software an analyst uses to understand a business need, document requirements, model how work flows, analyze data, and communicate recommendations to stakeholders. They cover the full arc from discovery to decision.
In practice, most analysts do not rely on a single application. They assemble a small stack: one tool to capture and track requirements, one to diagram processes, one to visualize data, and one to coordinate the people involved. Each tool answers a different question, and the analyst stitches the answers into a coherent story.
A useful business analysis tool does three things well. It captures information without friction, so people actually keep it current. It makes patterns visible, so a stakeholder can grasp the situation in seconds. And it connects to the rest of the stack, so the analysis does not die in an isolated file.
Why do business analysts still need dedicated tools?
General office software can carry a light analysis, but it breaks down as scope grows. Requirements written only in a document lose their traceability. Processes drawn once in slides drift out of date the moment the real workflow changes. Data pasted into static tables cannot be explored.
Dedicated tools solve the problems that generic files create. Requirements platforms keep every need linked to its source, its owner, and the work that satisfies it. Diagramming tools keep a living model of the process rather than a snapshot. Analytics platforms let a stakeholder ask a follow-up question instead of waiting for a new report.
The shift that matters most now is that these categories are becoming AI-assisted and collaborative by default. Modern platforms draft diagrams from a prompt, summarize survey responses, flag anomalies in a dataset, and keep several people working on the same canvas in real time. That changes what good looks like: the best tool is the one your team will keep current together, not the one with the longest feature list.
The business analysis toolkit, by category
Business analysis software falls into a handful of durable categories. The names on the market change, but the jobs do not. Below are the categories most analysts draw from, with strong current options in each. Treat these as a menu, not a shopping list. Most teams need two or three of these, chosen to fit the work in front of them.
Requirements management and modeling
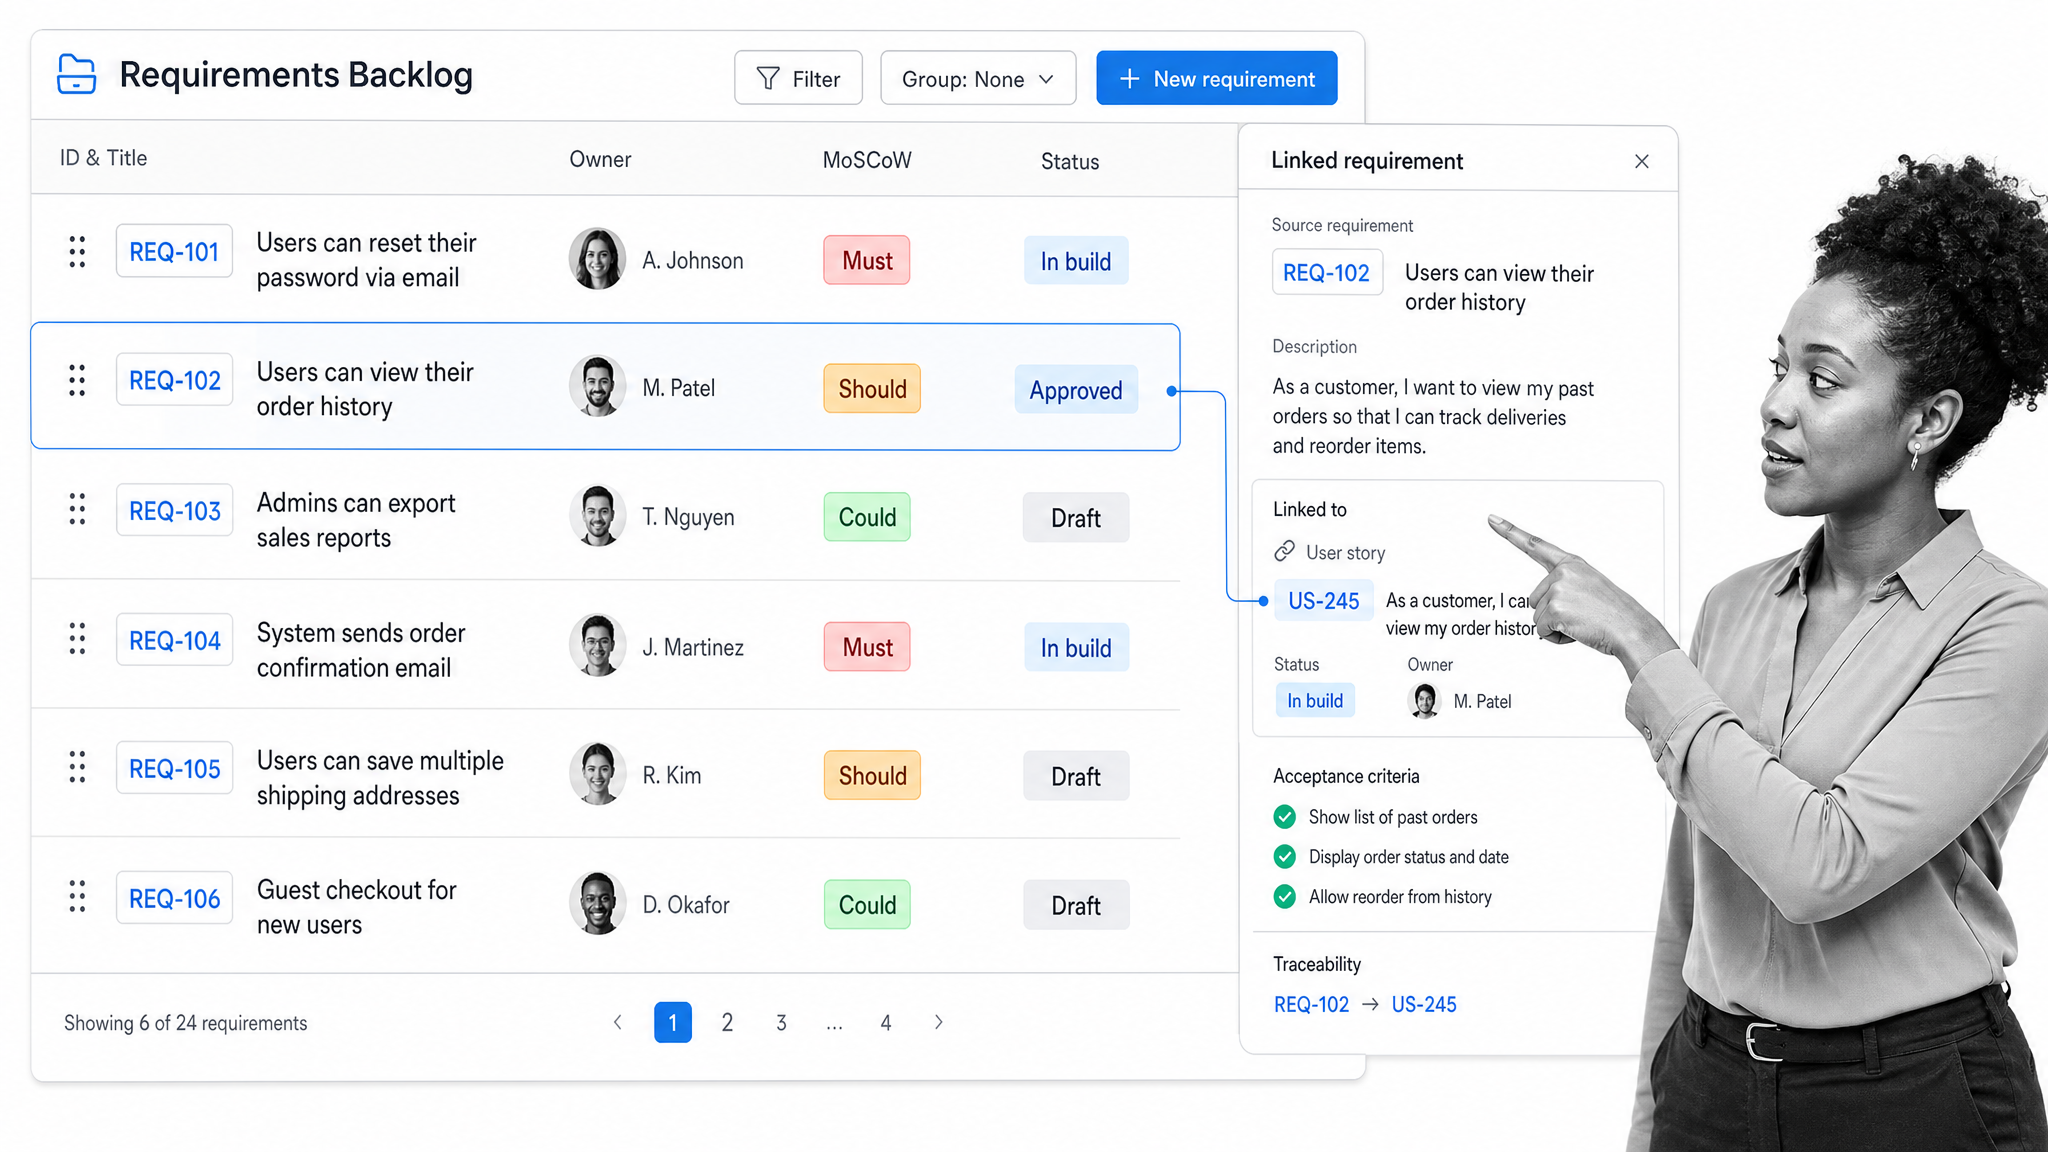
Requirements work is the backbone of business analysis: eliciting needs, writing them down, prioritizing them, and tracing each one through to delivery. Jira is widely used to track requirements and user stories alongside agile delivery, and its companion tool Confluence holds the supporting documentation and decisions. For heavier modeling, Sparx Systems Enterprise Architect handles formal notations and enterprise architecture, while Microsoft Visio remains a familiar choice for structured requirement and system diagrams.
- Jira and Confluence for requirement tracking, user stories, and living documentation
- Sparx Systems Enterprise Architect for formal modeling and architecture-scale work
- Microsoft Visio for structured diagrams tied to the Microsoft ecosystem
Diagramming and process mapping
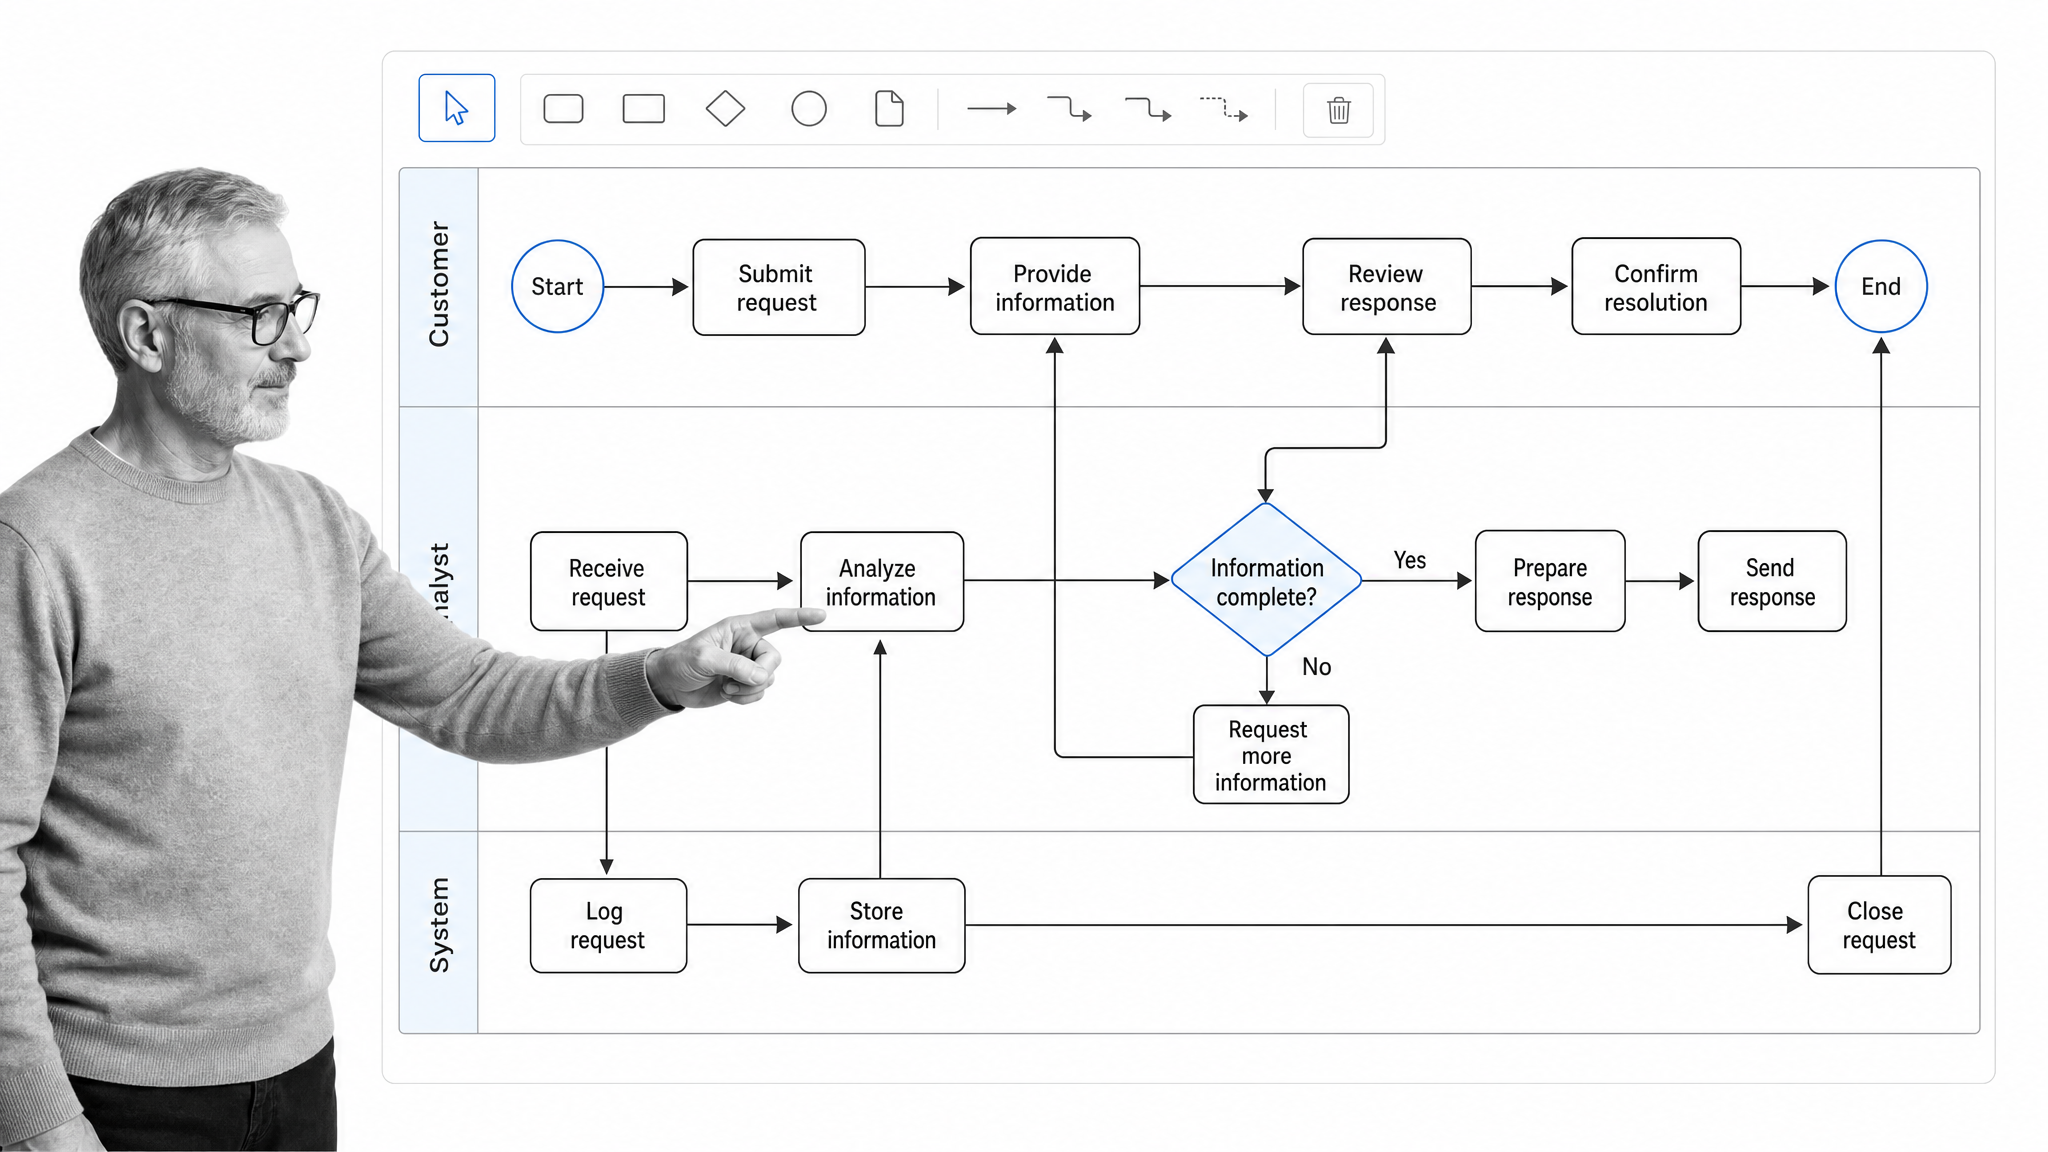
Process mapping is how an analyst shows the current state and the future state of how work gets done. Lucidchart is a cloud diagramming tool with real-time collaboration and process-modeling shapes, and it now offers AI-assisted diagram generation. Miro brings a broader visual collaboration canvas that suits discovery workshops and journey mapping, and draw.io provides a free, open diagramming option that embeds neatly into other tools.
- Lucidchart for collaborative process maps and flowcharts
- Miro for workshop-style mapping, affinity diagrams, and journey maps
- draw.io for lightweight, free diagramming that embeds anywhere
Business intelligence and data visualization
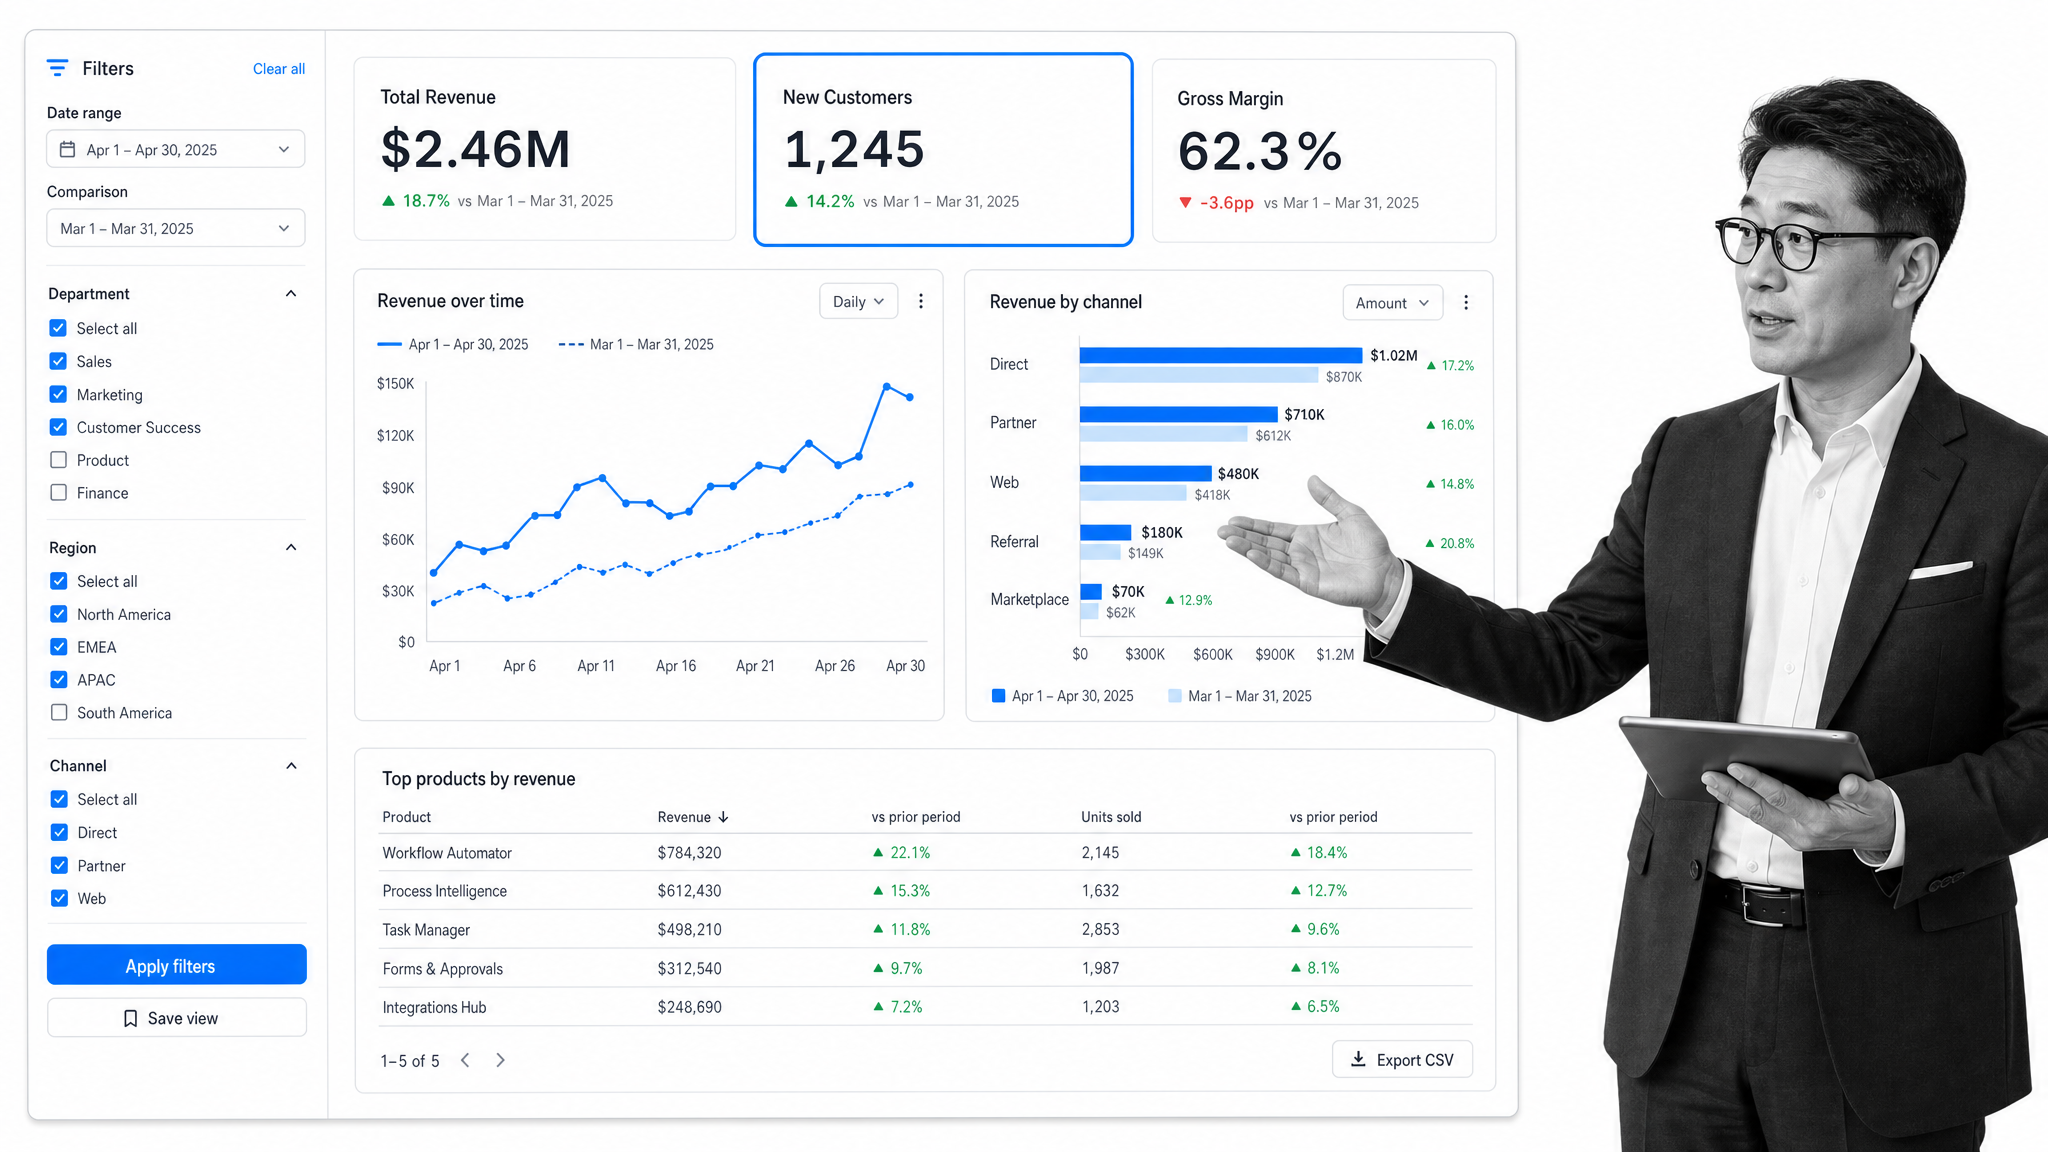
When a recommendation needs evidence, business intelligence tools turn raw data into dashboards a stakeholder can read. Microsoft Power BI connects to a wide range of sources and pairs naturally with the Microsoft data stack. Tableau is known for expressive, exploratory visualizations, Looker from Google Cloud brings a governed modeling layer for embedded analytics, and Qlik offers an associative engine for free-form data exploration.
- Microsoft Power BI for connected dashboards and broad data-source support
- Tableau for exploratory, presentation-grade visualization
- Looker for governed, embeddable analytics
- Qlik for associative, free-form data discovery
Prototyping and wireframing
When the analysis produces a product or interface change, low-fidelity mockups get everyone aligned before a line of code is written. Figma is a collaborative design canvas that has become a default for shared prototypes. Balsamiq keeps wireframes deliberately rough so the conversation stays on structure rather than styling, and Axure RP supports richer, interactive prototypes with conditional logic.
- Figma for collaborative, sharable prototypes
- Balsamiq for fast, low-fidelity wireframes
- Axure RP for interactive prototypes with logic
Collaboration and project tracking
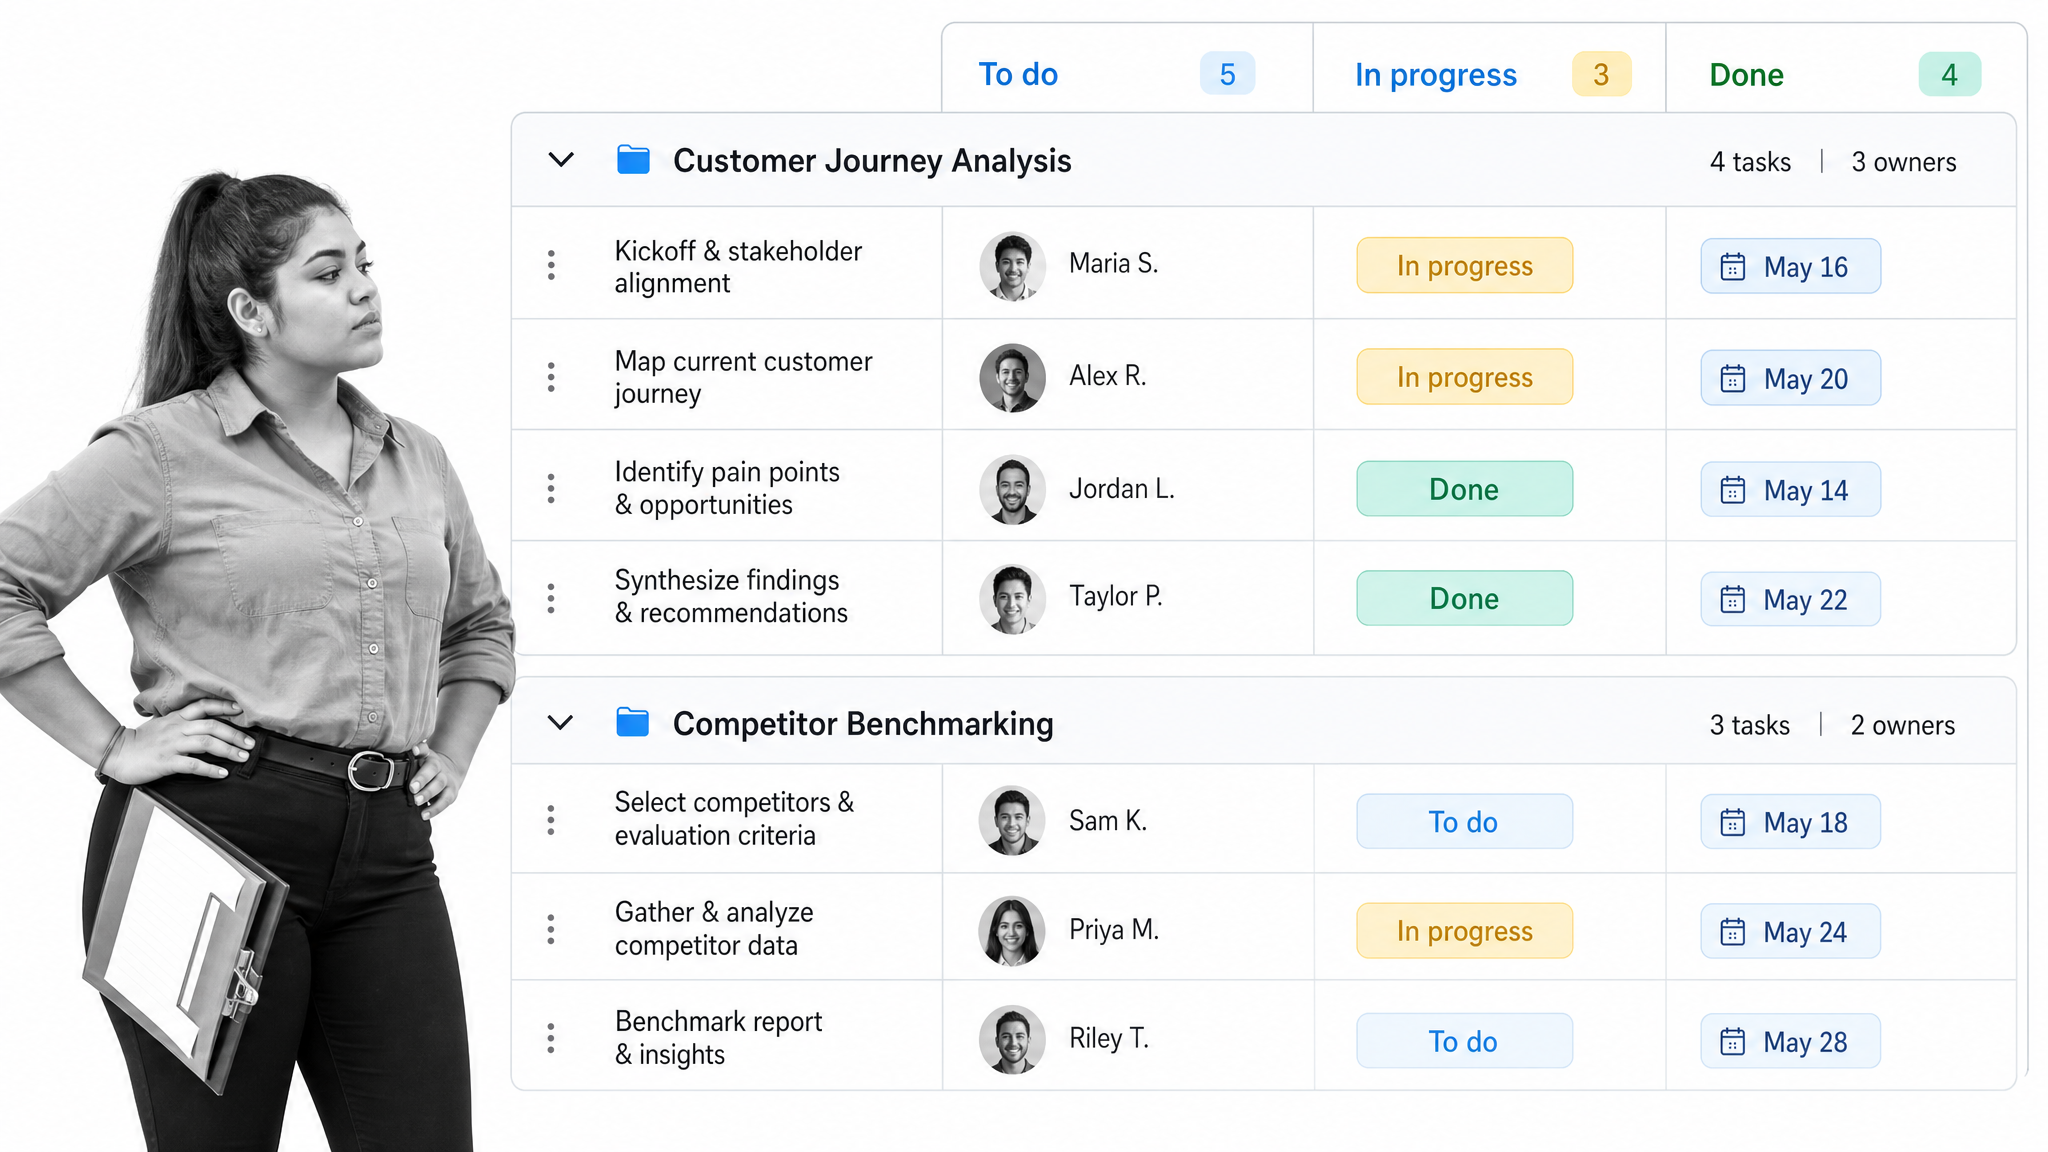
Analysis lives inside projects, and the work has to be coordinated. Asana, monday.com, ClickUp, and Trello each help teams assign owners, track tasks, and see status, ranging from simple boards to configurable portfolio views. Airtable sits between a spreadsheet and a database, which makes it handy for tracking requirements, stakeholders, or research findings in a structured yet flexible way.
- Asana, monday.com, and ClickUp for task ownership and status across projects
- Trello for simple, visual boards
- Airtable for structured tracking of requirements, stakeholders, or research
Data analysis and statistics
Some analysis needs more than a chart. Alteryx builds repeatable data-preparation and analytics workflows without heavy coding. Minitab focuses on statistical analysis and quality improvement, and is a common companion for process-improvement work. These tools help an analyst move from a hunch to a defensible, quantified finding.
- Alteryx for repeatable data preparation and analytics pipelines
- Minitab for statistical analysis and quality improvement
Customer insight and web analytics
Much of modern business analysis is about customer behavior. Google Analytics measures how people move through digital properties. Hotjar adds qualitative signal through heatmaps and session insight, and Qualtrics runs structured surveys and experience research. Together they help an analyst connect what customers do with why they do it.
- Google Analytics for digital behavior measurement
- Hotjar for heatmaps and qualitative on-page insight
- Qualtrics for surveys and experience research
Which business analysis techniques do these tools support?
Tools only matter because they support techniques. A tool is the vehicle; the technique is the method. The strongest analysts are fluent in the methods first, then pick tools that make those methods faster to run and easier to share.
A core set of techniques shows up across almost every project. Diagramming and BI tools give each of them a natural home.
- SWOT analysis frames internal strengths and weaknesses against external opportunities and threats, and fits neatly on a shared whiteboard canvas.
- PESTLE analysis scans the macro environment, covering political, economic, social, technological, legal, and environmental factors.
- MOST analysis aligns mission, objectives, strategy, and tactics so a change stays connected to intent.
- Stakeholder analysis maps who is affected and how much influence they hold, often as a grid or map inside a collaboration tool.
- Requirements elicitation gathers needs through interviews, workshops, and surveys, then records them in a requirements or documentation tool.
- Process modeling captures how work flows today and how it should flow tomorrow, usually in a diagramming tool using a standard notation.
- MoSCoW prioritization sorts requirements into must, should, could, and will-not, keeping scope honest.
The pattern is consistent: a technique produces a specific artifact, and a category of tool exists to hold that artifact and keep it current. Choosing tools becomes much simpler once you know which techniques your projects actually rely on.
How do you choose the right business analysis tool?
The best tool is the one your team will actually keep updated. A brilliant model nobody maintains is worse than a simple one everyone trusts. Start from the work, not from the feature grid.
A short set of questions narrows the field quickly:
- Which technique is this tool for? Match the tool to the job, whether that is requirements, process mapping, visualization, or coordination.
- Will stakeholders use it, or just the analyst? A tool the whole team can open lowers the cost of every review.
- Does it connect to your existing stack? Isolated tools create silos and rekeying.
- How fast can someone capture a change? If updating the model is slow, the model goes stale.
- Does it fit your governance needs? Regulated work needs access control, history, and an audit trail.
Resist the urge to standardize on one platform for everything. Analysts get the most leverage from a small, deliberate stack: a tool per core technique, connected well enough that the analysis flows between them. Add tools when a real technique needs a home, and retire the ones your team stopped opening.
What does AI-native business analysis look like?
Every category in this guide is being rebuilt around AI, and that changes the day-to-day work of analysis more than any single new tool. The mechanical parts of the job, drafting a diagram, cleaning a dataset, summarizing thirty interview notes, are increasingly handled by the tool itself, which frees the analyst to spend time on judgment and stakeholder alignment.
In practice, AI-native business analysis looks like a set of small, compounding accelerations across the stack:
- Diagramming tools generate a first-draft process map from a plain-language description, so the analyst starts by editing rather than by drawing.
- Analytics tools answer a question in natural language and surface anomalies without a hand-built query, shortening the path from data to insight.
- Requirements tools cluster and summarize raw feedback, turning a backlog of tickets into themed needs.
- Workflow platforms use AI agents to watch how a process actually runs, flag where it breaks down, and propose a fix.
The catch is that AI is only as good as the structure it works inside. An agent that drafts a workflow needs a clear model of how the business is supposed to operate. That is why the analysis and the execution layer have to stay connected: well-documented processes become the reliable source of truth that AI systems act on, and messy ones just get automated faster.
The durable skill, then, is not tool operation. It is framing the right problem, choosing the right technique, and keeping the resulting model current enough that both people and AI agents can trust it. The tools accelerate the work, but the analyst still owns the judgment.
Where Process Street fits in the modern stack
Business analysis does not end when a recommendation is approved. The findings have to become how work actually gets done, and stay that way as the business changes. That handoff from analysis to execution is where most improvement efforts quietly fall apart.
Process Street for workflow and process management
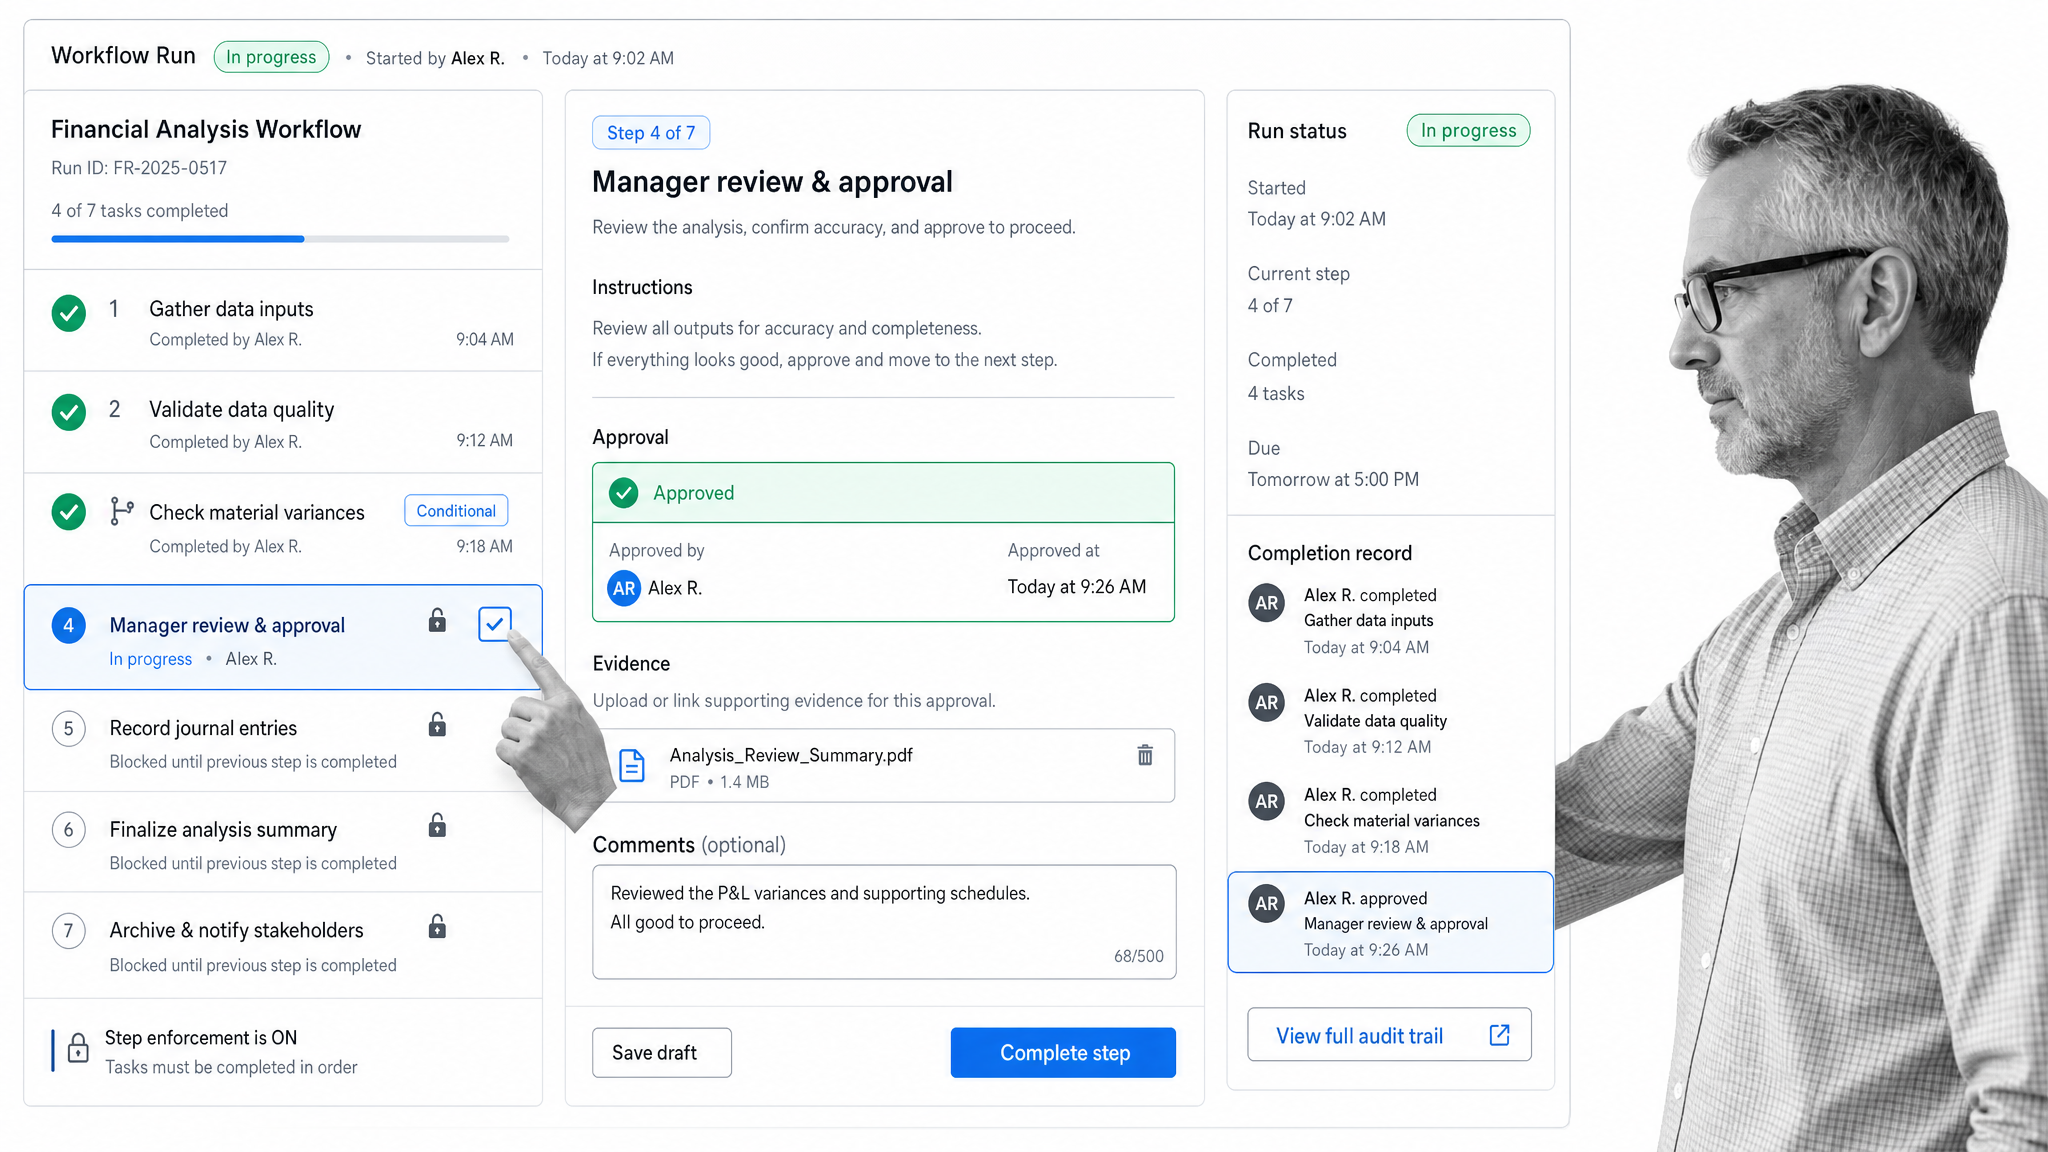
Process Street is the AI-native workflow runtime that turns a mapped process into a workflow that runs, enforces each step, and produces a live record of what happened. An analyst can take the future-state process they modeled and stand it up as an executable workflow, so the improvement lands in daily operations instead of a slide deck.
The platform pairs governed documentation with execution by default. Every task completed reinforces the correct procedure, conditional logic routes work to the right owner, and a built-in AI agent monitors execution, flags risk, and suggests updates as processes evolve. Process Street has direct, universal integrations to 5,000+ systems, and when you need one that is not pre-wired, an AI agent builds the connection on the fly.
For the coordination layer around analysis projects, teams also lean on project management tools, and Process Street sits alongside them as the system that governs how the agreed process is actually run. It is built for regulated, high-stakes operations that need enforcement and proof, not just visibility.
Business analysis tools FAQs
What are business analysis tools?
Business analysis tools are software an analyst uses to understand a business need, capture and trace requirements, model how work flows, analyze data, and communicate recommendations. Most analysts combine several: a requirements tool, a diagramming tool, an analytics tool, and a coordination tool.
What is the difference between business analysis and data analytics tools?
Business analysis tools support the whole discipline of defining needs and recommending solutions, including requirements, process modeling, and stakeholder work. Data analytics and business intelligence tools are a subset focused on turning data into insight. An analyst uses analytics tools inside the broader business analysis process.
Which business analysis tools are best for beginners?
Beginners get the most value from tools that are easy to open and share. Cloud diagramming tools like Lucidchart or Miro, a spreadsheet-database like Airtable, and an accessible dashboard tool make it simple to practice core techniques before adopting heavier, specialized platforms.
Are there free business analysis tools available?
Yes. Several strong options offer free tiers or open editions, including draw.io for diagramming and free plans on many collaboration and analytics tools. Free tiers are a sensible way to learn a technique and prove value before committing to a paid plan.
How many business analysis tools does a team actually need?
Most teams need only two or three, chosen by technique rather than by brand. A common stack is one tool for requirements, one for process mapping, and one for data visualization, coordinated inside a project tool. Add a tool only when a real technique needs a home.
How is AI changing business analysis tools?
AI is making analysis tools faster and more collaborative. Diagramming tools draft maps from a prompt, analytics tools summarize data and flag anomalies, and workflow platforms use AI agents to monitor execution and suggest improvements. The advantage goes to teams that keep their analysis and processes continuously current.