


Turn every policy into automated workflows with built-in enforcement and audit-ready proof.



Workflow Diagram Software: A Complete Guide
Workflow diagram software turns a process that lives in someone’s head into a picture the whole team can see. Instead of describing how an approval, an onboarding, or a fulfillment flow is supposed to work, you draw it: each step as a shape, each decision as a branch, each handoff as an arrow between the people responsible.
This guide explains what workflow diagram software is, what separates a strong tool from a weak one, which tools are worth a look, the main diagram types you will use, and how to go from a first sketch to a process your team actually follows. If you only remember one thing: a diagram is where clarity starts, but execution is where the value is.
- What is workflow diagram software?
- What should you look for in workflow diagram software?
- The best workflow diagram software
- What are the main types of workflow diagrams?
- Why do workflow diagrams matter?
- How do you create a workflow diagram?
- Workflow diagram examples
- Where Process Street fits: from diagram to execution
- Frequently asked questions
What is workflow diagram software?
A workflow diagram is a visual representation of the steps, decisions, and handoffs involved in completing a process. Workflow diagram software is the tool you use to build those diagrams, using standardized shapes to represent tasks, decision points, inputs, and outputs so anyone can follow the flow from start to finish.
Most tools share a common visual language. Rectangles represent tasks or actions, diamonds represent decisions where the path can split, ovals mark the start and end, and arrows show the direction work moves. These conventions are standardized (ANSI and ISO), which is why a well-drawn diagram reads the same way to a new hire and a seasoned manager.
Good software goes beyond drawing. It offers ready-made templates and shape libraries, real-time collaboration so a team can map a process together, and links to the systems where the work happens. The best tools also make it easy to keep a diagram current, because a process map that no longer matches reality is worse than no map at all.
What should you look for in workflow diagram software?
The right tool depends on who will use it and what happens after the diagram is drawn. A few criteria matter across almost every team:
- Ease of use. Non-technical owners should be able to build and edit diagrams without training. If only one specialist can touch the map, it will go stale.
- Templates and shape libraries. Prebuilt flowchart, swimlane, and process-map shapes get you to a first draft in minutes rather than hours.
- Real-time collaboration. Mapping a process is a team sport. Commenting, shared editing, and version history keep everyone aligned.
- Integrations. A diagram is more useful when it connects to the tools where work actually runs, from project trackers to your systems of record.
- From diagram to execution. The strongest platforms let a mapped process become a workflow people run, with tasks, owners, and automation, not just a static picture.
That last point is where most diagramming tools stop and where an execution platform like Process Street begins. Keep it in mind as you compare options: a beautiful diagram that nobody follows has not changed how work gets done.
The best workflow diagram software
We have used and tested a range of diagramming tools. The options below stand out for building clear workflow diagrams in the current market. Each fits a slightly different need, so match the tool to your team rather than chasing the longest feature list.
Lucidchart
Lucidchart is a widely used diagramming platform for flowcharts, process maps, and technical diagrams, with AI-assisted diagram creation and automation. Its collaborative canvas and large template library make it a strong default for teams that want polished, shareable diagrams and integrations with the tools they already use.
Microsoft Visio
Microsoft Visio is a long-standing diagramming tool that suits organizations already invested in the Microsoft ecosystem. It offers swimlane-enabled process diagrams and shape data for structured documentation, which makes it a common choice for detailed organizational and process visualizations.
draw.io (diagrams.net)
draw.io, also known as diagrams.net, is a free and open-source diagramming tool. It runs in the browser with no sign-up required and stores diagrams where you choose, which makes it popular with technical teams and anyone who wants a capable flowchart tool without a subscription.
Miro
Miro is a collaborative visual workspace that supports diagramming alongside brainstorming and workshops. It handles flowcharts, UML, and process maps, including AI-assisted generation, and shines when a team wants to map a process together on a shared, infinite canvas.
Creately
Creately is a visual collaboration and diagramming platform built around a smart canvas, moving teams from idea to execution with diagramming, whiteboarding, and customizable workflows. It is a good fit for teams that want visual planning and process mapping in one place.
SmartDraw
SmartDraw is a diagramming tool known for automated formatting that arranges shapes and connectors as you build. That automation lowers the effort of producing clean flowcharts, org charts, and technical diagrams, which appeals to users who would rather describe a process than fuss with layout.
Cacoo
Cacoo, from Nulab, is an online diagramming tool focused on real-time collaboration. It is well suited to distributed teams building flowcharts and wireframes together, with a straightforward canvas for diagramming, brainstorming, and building ideas in one shared space.
Process Street
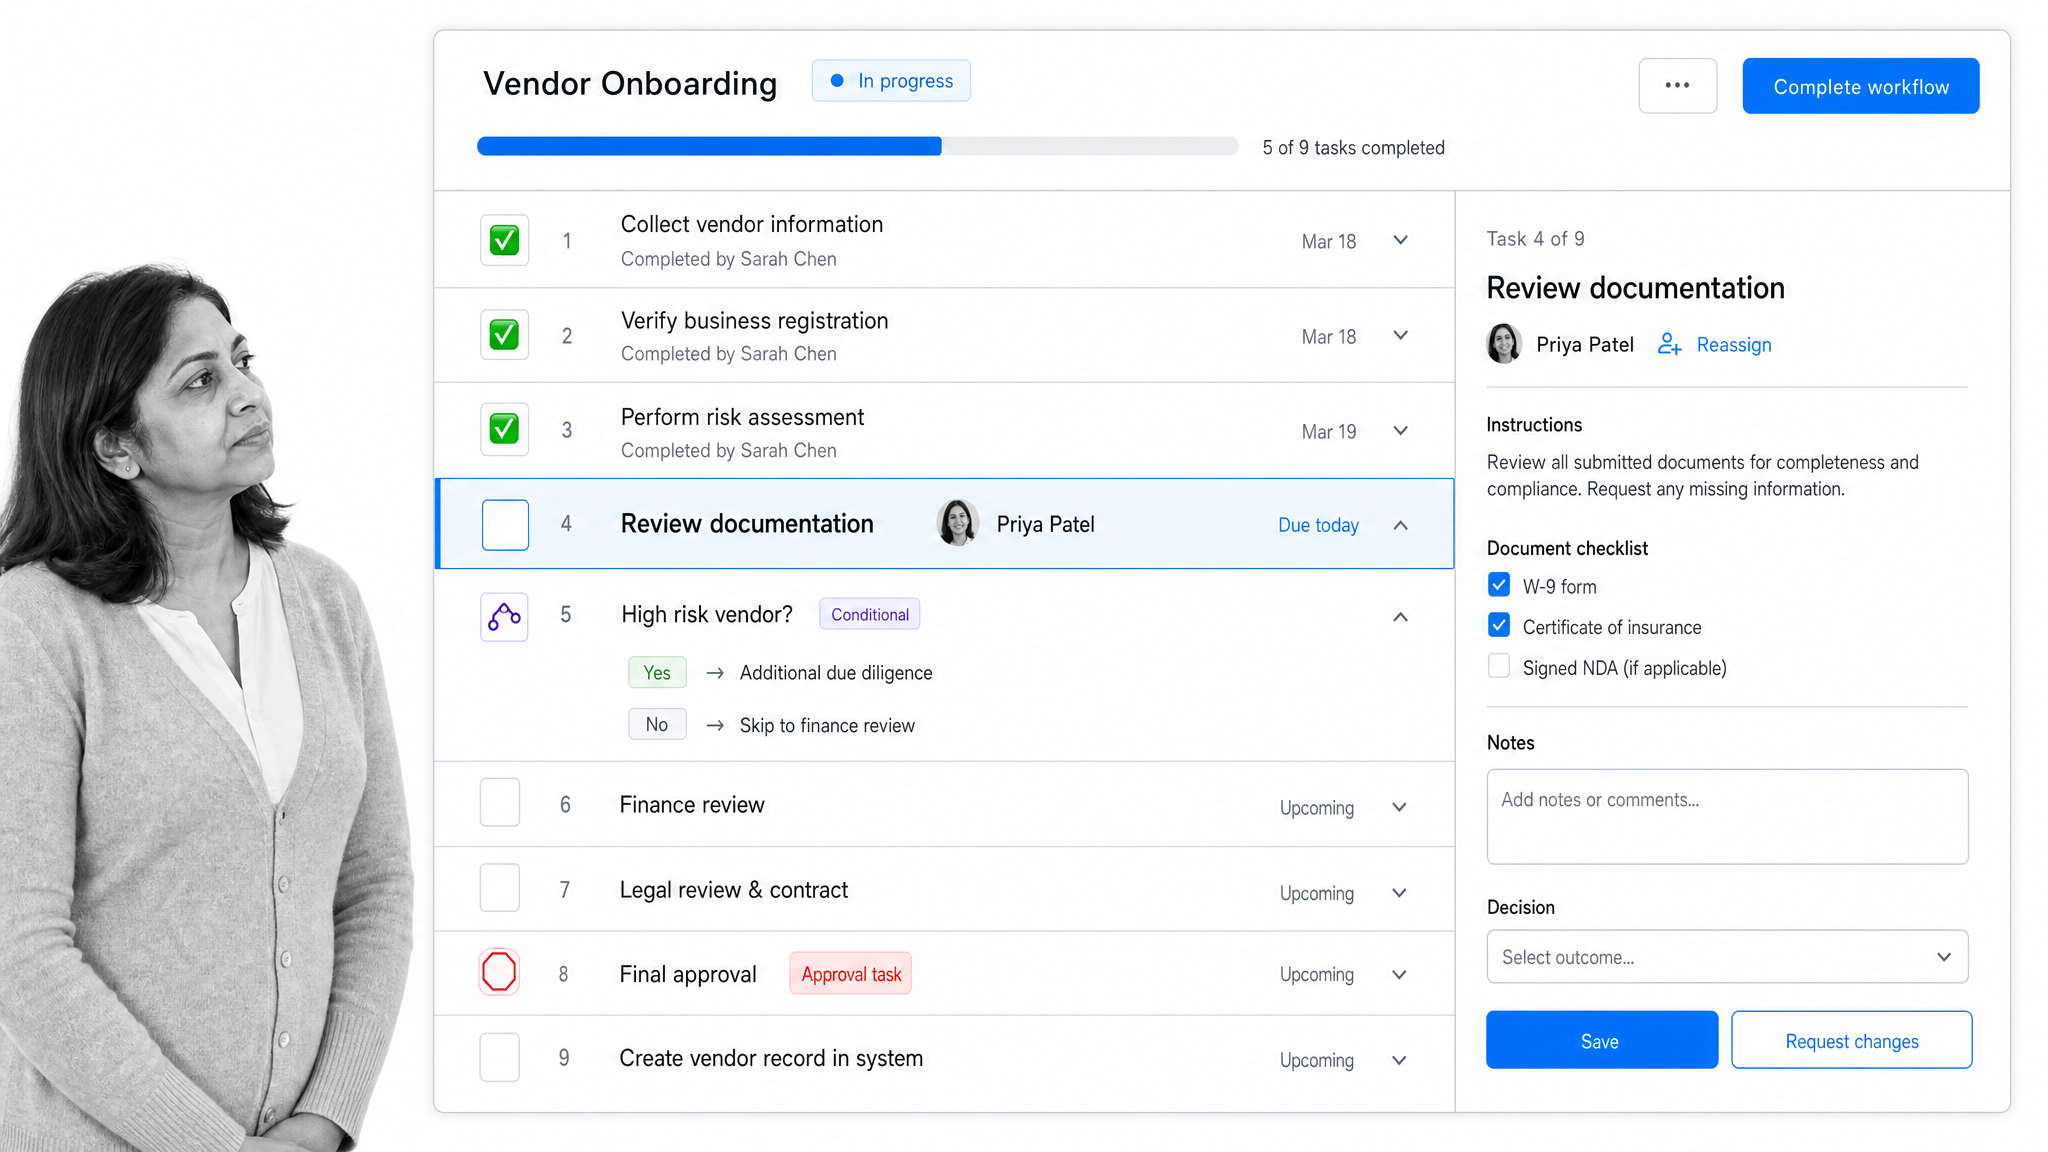
Process Street is where a workflow diagram becomes work that actually happens. Rather than leaving a process as a static picture, Process Street turns it into an AI-native workflow that people run: every step has an owner, conditional logic routes work down the right branch, and automation sends forms, collects approvals, and updates records as the process moves. It is the execution layer that a diagram points toward, closing the gap between how a process is drawn and how it is done.
What are the main types of workflow diagrams?
Different processes call for different diagram styles. These are the types you will reach for most often.
Flowchart
The flowchart is the most common workflow diagram. It uses rectangles for tasks, diamonds for decisions, and arrows for flow to show a process from start to finish. Flowcharts are ideal for linear or branching processes where the goal is a clear, step-by-step path.
Swimlane diagram
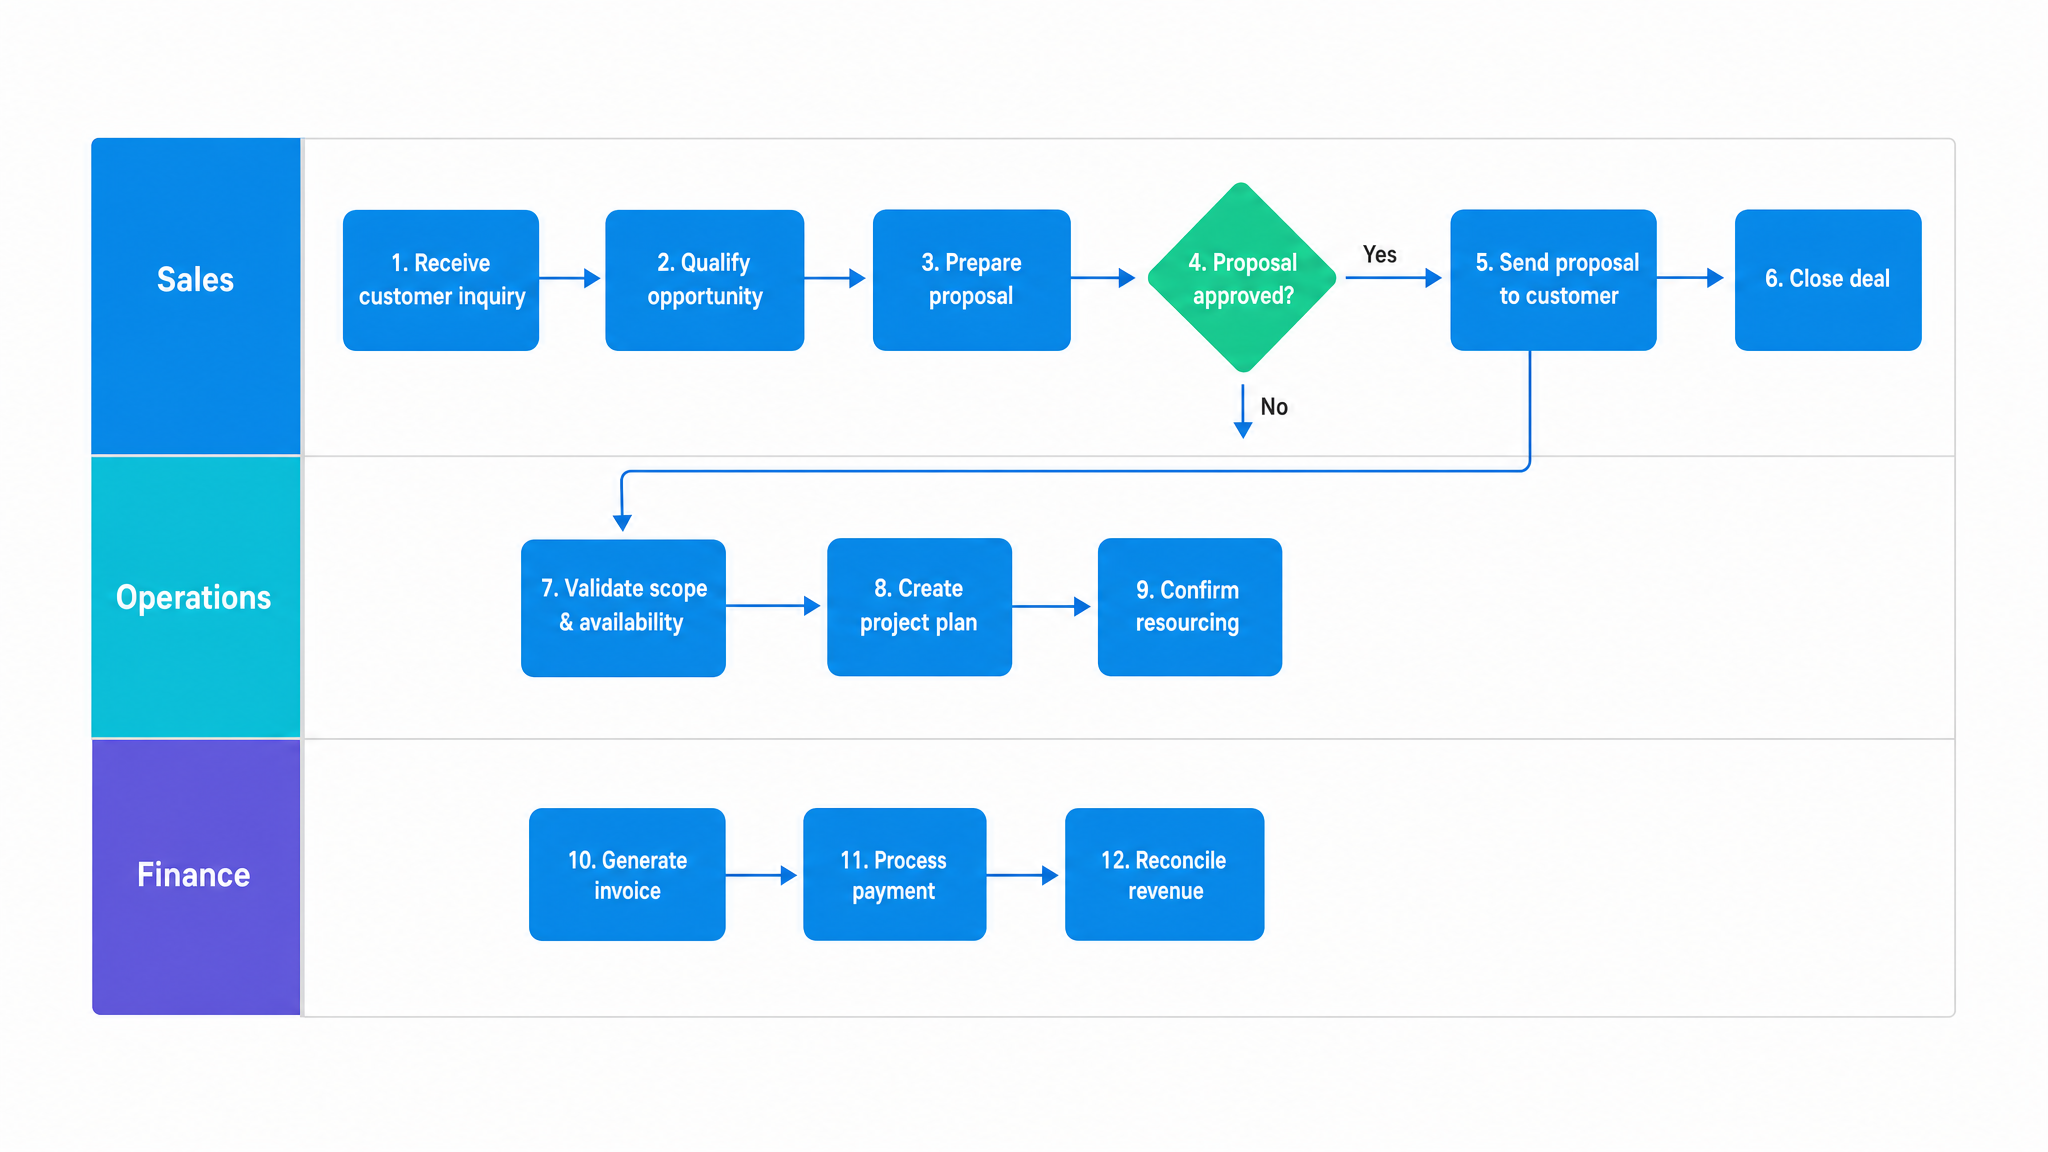
A swimlane diagram divides a flow into lanes, one per person, role, or department, so it is obvious who owns each step and where work is handed off. Swimlanes are the right choice for cross-functional processes where accountability and handoffs matter as much as the sequence.
BPMN diagram
Business Process Model and Notation (BPMN) is a standardized notation, maintained by the Object Management Group, for modeling business processes in detail. BPMN adds a richer vocabulary of events, gateways, and activities, which makes it the standard for process analysts documenting complex, formal workflows.
Data flow diagram
A data flow diagram maps how information moves through a system rather than how tasks are sequenced. It focuses on inputs, processing, storage, and outputs, which makes it useful when the process is really about moving and transforming data between systems.
Why do workflow diagrams matter?
A clear workflow diagram does more than look tidy. It gives a team a shared reference for how work should be done, which is the foundation for training, improvement, and accountability.
- Visibility. Everyone can see the whole process at once, so misunderstandings about who does what tend to disappear.
- Bottleneck spotting. Drawing a process makes its weak points obvious: the step where work piles up, the approval that stalls, the redundant handoff.
- Faster onboarding. A new hire who can see the flow learns the job faster than one who has to reconstruct it from tribal knowledge.
- A path to automation. Once a process is mapped, the repetitive, rules-based steps become obvious candidates to automate.
The stakes are higher than they look. Gallup found that roughly one in five employees are engaged at work, an estimated ten trillion dollars in lost productivity worldwide. Unclear, undocumented processes are a quiet contributor: when people are not sure how work is supposed to flow, they disengage and rework multiplies. A shared diagram is a small, concrete step toward clarity.
How do you create a workflow diagram?
You do not need to be a designer to draw a useful workflow diagram. Follow a simple sequence and refine it with the people who do the work.
Choose the process to map
Pick one process with a clear beginning and end, such as employee onboarding, invoice approval, or customer handoff. Resist the urge to map everything at once. One well-scoped process is more useful than a sprawling, unfinished one.
List the steps and decisions
Write out every task in order, along with the decision points where the path can branch and the person or team responsible for each. Talk to the people who actually run the process so the map reflects reality, not the ideal version nobody follows.
Draw the diagram
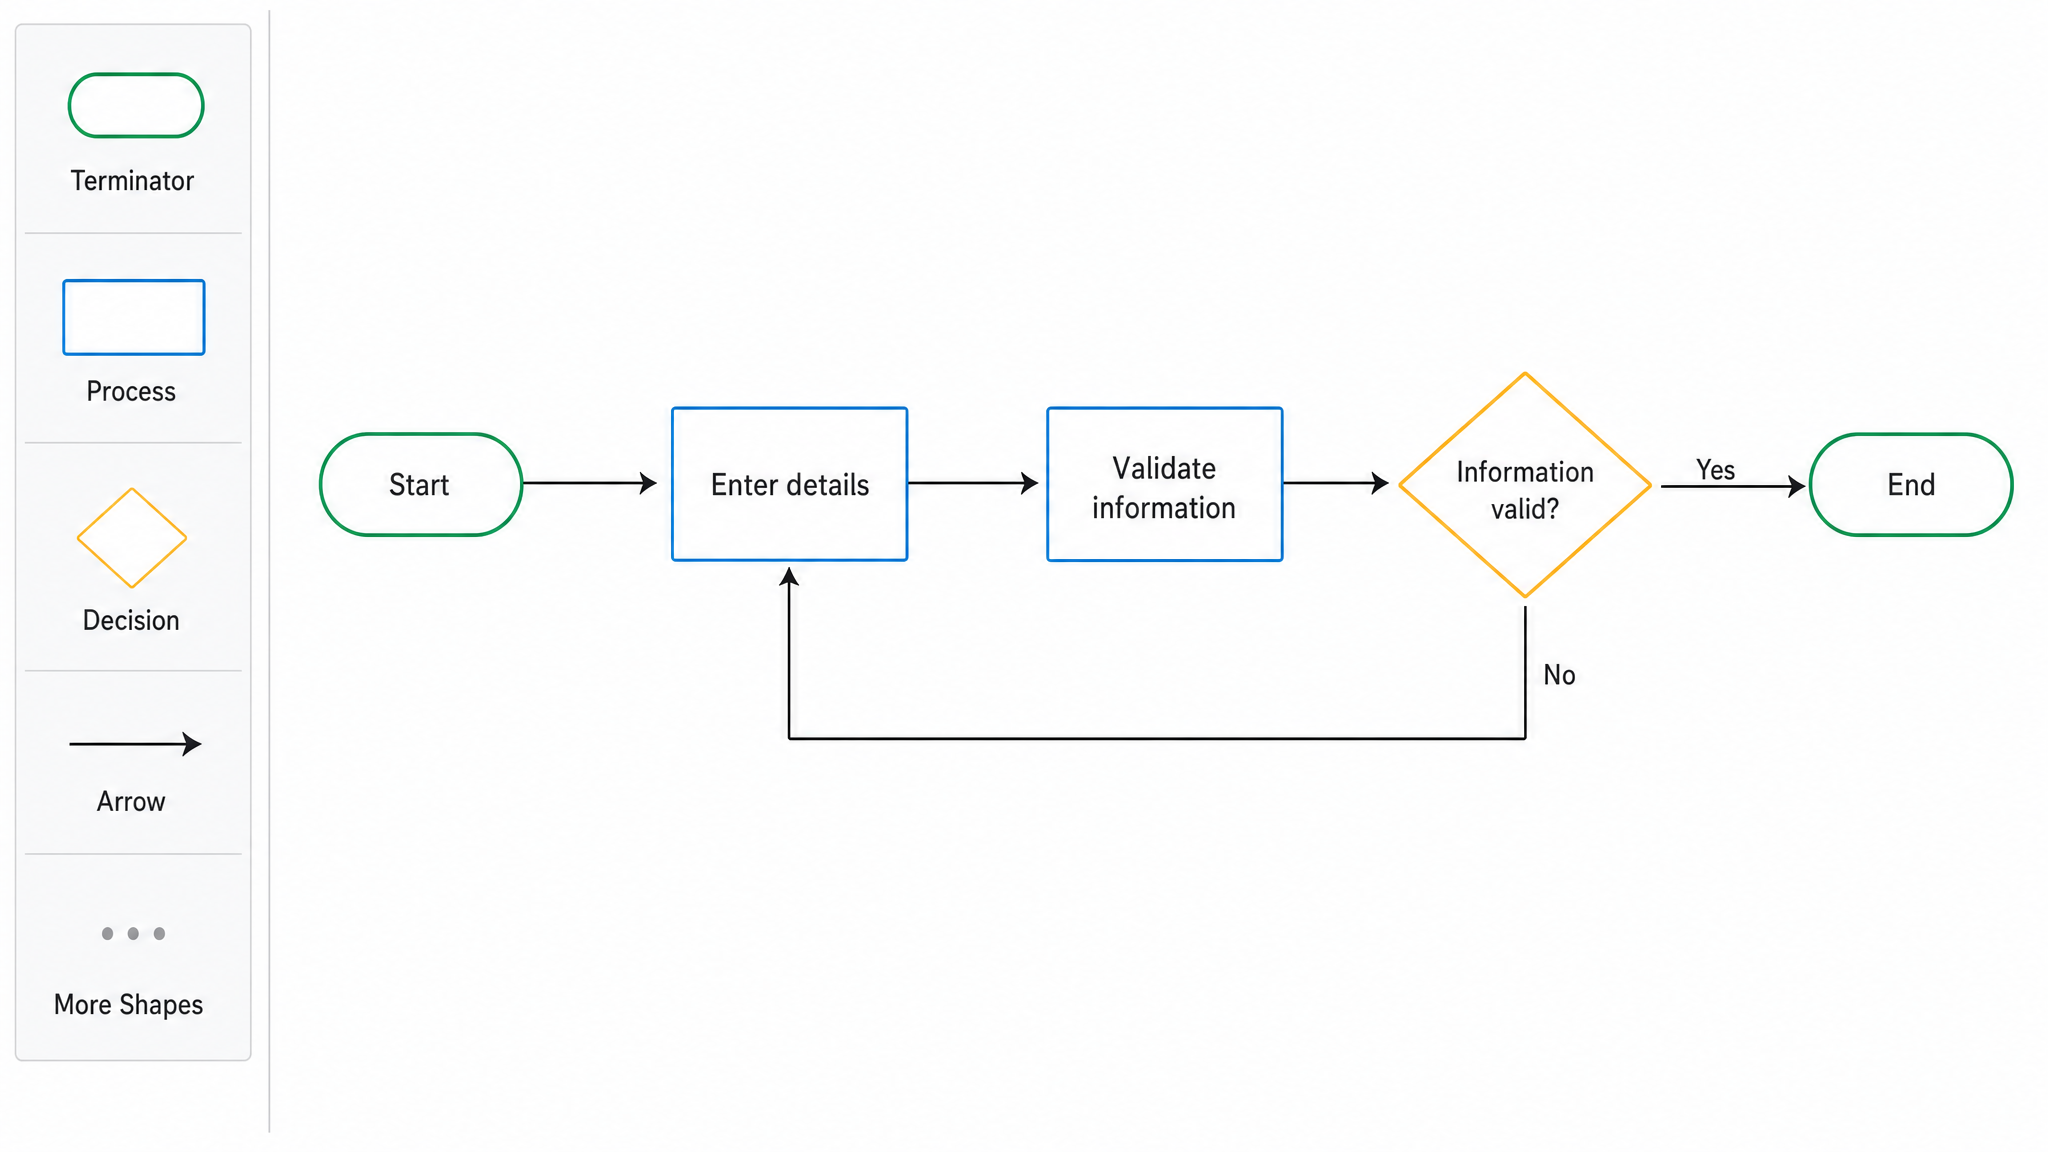
Open your workflow diagram software and arrange the steps using standard shapes: rectangles for tasks, diamonds for decisions, ovals for start and end. Connect them with arrows to show the flow, add swimlanes if roles matter, then review the draft with your team and refine it until it matches how work is truly done.
Turn the diagram into a workflow
A diagram earns its keep when people follow it. Move the mapped process into a platform where each step becomes a task with an owner, where conditional logic routes work down the right branch, and where automation handles the repetitive parts. That is the difference between documenting a process and running one.
Workflow diagram examples
Workflow diagrams show up in every industry. A few concrete examples make the range clear.
Software development
A development team maps the path from a feature request to release: triage, build, code review, testing, and deployment, with decision points where a failed review or test sends the work back a step. The diagram keeps a fast-moving process legible as the team grows.
E-commerce
An online retailer maps order fulfillment from checkout to delivery: payment, inventory check, packing, shipping, and returns handling, with branches for out-of-stock items and refunds. Mapping it surfaces the handoffs where orders stall.
Healthcare
A clinic maps patient intake across the front desk, nursing, and billing using swimlanes so each role sees its part. Clear handoffs reduce errors in a setting where mistakes are costly and documentation is required.
Finance
A finance team maps invoice approval: submission, manager review, a decision point for amounts over a threshold, and payment. The diagram makes the control points visible, which matters when audits ask you to prove that a policy was followed.
Where Process Street fits: from diagram to execution
A diagram tells you how a process should work. Process Street makes sure it actually works that way. It takes the flow you have mapped and turns it into an AI-native workflow your team runs every time, so the picture on the wall and the work on the floor never drift apart.
Because processes rarely live in one system, connections matter. Process Street has direct, universal integrations to 5,000+ systems. Need a new one? An AI agent builds it on the fly. That means the workflow you designed from a diagram can send forms, collect approvals, and update records across the tools you already use, without waiting on IT.
If you are ready to move past static pictures, start by turning your most important process into a runnable workflow. A good process mapping exercise is the bridge, and Process Street’s workflow templates give you a running start.
Frequently asked questions
What is workflow diagram software?
Workflow diagram software is a tool that lets you visually map and document the steps, decisions, and flow of a business process. These diagrams help teams understand how work moves through an organization, identify bottlenecks, and communicate process changes clearly to everyone involved.
How do I create a workflow diagram?
Start by identifying the process you want to map, then list every step and decision point involved. Use a workflow diagram tool to arrange those steps in sequence with standard shapes, rectangles for tasks and diamonds for decisions, connect them with arrows to show the flow, then review and refine the diagram with your team so it matches how work is really done.
What are the benefits of using workflow diagrams in business?
Workflow diagrams improve process clarity by giving teams a shared visual reference for how work should be done. They help identify inefficiencies, reduce miscommunication, speed up training, and provide documentation for compliance. Visual process maps also make it easier to spot redundant steps and opportunities to automate.
What is the difference between a workflow diagram and a flowchart?
A flowchart is a general-purpose diagram that can represent any sequential process or algorithm, while a workflow diagram specifically maps business workflows, including roles, responsibilities, and handoffs between teams. Workflow diagrams often use swimlanes to show which department or person handles each step, adding organizational context that a standard flowchart lacks.
Can workflow diagram software automate my business processes?
Diagramming tools on their own produce a static picture and do not run the process for you. To automate, you move the mapped process into an execution platform like Process Street, where each step becomes a task with an owner, conditional logic routes the work, and automation sends forms, collects approvals, and updates records as the process runs.