
Click here to visually map and improve your business processes now!
Did you know that visual information is processed 60,000 x faster than text?
This explains why the average person remembers only 20% of what they read but 40% of what they see. This also explains why most companies use a form of visual management to communicate with their employees.
Let’s do a little test to see if people, in general, respond better to visual cues than text.
Look at these two depictions of a traffic light below.
One is a sentence describing a traffic light, and one is an image of a traffic light. Both traffic lights are on different colors:
1. The traffic light is on red.
2.
At the end of this Process Street post, we’ll see which color traffic light you remember! No cheating mind!
In the meantime, I’ll take you through the following topics to explain what visual management is and how you can use it to effectively communicate with your employees:
- What is visual management?
- Why use visual management?
- The 3 golden rules of visual management
- Implementing visual management with Process Street
What is visual management?
Visual management is a way of communicating key messages in a visual way that can be interpreted, without much thought, by anyone and everyone.
It’s when companies use visual cues such as dashboards, displays, labels, signs, color coding, and other markings, instead of written instructions to communicate with their staff.
Visual management is also one of the most intuitive elements of a lean management system (LMS) because it should enable anyone entering a workforce, even visitors or newcomers, to see and understand what’s going on at a glance.
“Visual management is the lifeblood of a lean production system. It provides insight across teams, departments, and management. It is the link between the people and the data” – TXM, The Definitive Guide to Lean Management
Speaking of lean management, Process Street has created a number of templates that you can use, in your organization, to reduce waste and increase quality and productivity.
Have a quick look at our SIPOC Template now, and I’ll include a few more, later in the post.
Use this SIPOC Template to analyze all the different processes within a working system, to identify where improvements can be made.
Click here to access the SIPOC Template!
This checklist is free to use, simply click on the link and add it to your dashboard. If you’re not yet a Process Street user, sign up for a free trial.
Visual management isn’t just an element of lean management or a simple form of communication. Visual management can also be used to manage processes within your organization.
How to manage your processes visually
You can visually represent processes within your organization through business process modeling techniques, like these for example:
- Flow charts
- Swimlane diagrams
- State diagrams
- Data flow diagrams
- Value stream mapping
This will enable you to see and assess your business processes and begin to improve them. Mapping out your processes like this enables everyone to see the process in the same way and helps identify efficiencies, gaps, or unnecessary steps.
Here are a couple of articles on improving processes and business process modeling that you should definitely take a look at:
- Why You Should Bother With Business Process Modeling
- BPMN Tutorial: Quick-Start Guide to Business Process Model and Notation
- A Simple Guide to Process Modeling & Optimization with UML Diagrams
- Business Process Optimization: How to Improve Workflows Like a Pro (Free Templates!)
And, as if that wasn’t enough to help you improve your processes, we’ve also got the below process for optimizing a process that you might find useful too:
Click here to access the Process for Optimizing a Process!
Anyway, let’s park the idea of improving processes for now and get back to the concept of visual management.
Although it sits outside of the workplace, this is an example of visual management that you’ll see every day. In fact, you saw one earlier – in this post.
The trusty old traffic light.

The red, amber, and green lights are universally understood by everyone around the world, and they visually communicate clear messages about when to stop, when to get ready, and when to go.
This example of visual management leads me, quite nicely, to talk about the benefits of visual management and why companies should use it.
Why use visual management?
More and more companies are choosing to use visual management cues to communicate with their staff, as opposed to relying on written or verbal communication techniques.
But what’s so good about visual management? I hear you ask.
Good question. Let’s find out.
Visual management spots mistakes
“If I can see it, I can fix it… it’s hard to fix what you can’t see” – Lean Enterprise Institute, Visual Management: The Good the Bad, and the Ugly
Visual management makes it easy to do the right thing and impossible to do the wrong thing.
How?
Because you can see, as clear as day, what’s working and what isn’t.
It’s like a form of error-proofing (or poka-yoke, to continue with the lean theme).
For instance, a Pareto chart can be used to see where the biggest problems lie in a new process, an online dashboard could be used to track the status of projects and tasks, or a shadow board might be used to warn people when something is missing.

Fun fact: In Alcatraz, they used to mark where knives should hang in the kitchen, so if one went missing, there would be a shadow line to warn the guards that a prisoner had stolen a knife!
Visual management increases motivation
“How can the team be expected to win if they don’t know the score?” – Clarity, The Benefits of Lean Visual Management
Implementing visual management enables employees to see the direct impact their work is having on the team and the wider company. This can help them feel more connected to their jobs because they’re in control of what they’re doing and they can see the effect they’re having on the organization.
In my previous role as a digital project manager, we used to have this big whiteboard that sat, in full display, at the front of the office.
This board would get updated daily with the status of each project.
We’d draw a green tick if the project was on track. An orange circle meant it was slightly delayed, and a red cross meant the project was dangerously behind.

This simple form of visual management made each person in the project team take accountability for their work and it did wonders for the team’s motivation. You could see the devastation in their faces if the project they were working on had a big red cross next to it. And you could see it in their performance too! No one wanted to work on a ‘red cross project‘.
Visual management makes information easy to understand
“Through communicating information visually, it requires no interpretation to understand” – Six Sigma Material, Visual Management
Which, out of the two below messages, do you understand best?
Smettere di fumare!
or,

The picture message, right? (It doesn’t count if you speak Italian!)
As we’ve already discovered, visual management is a great way to communicate key messages to a wide audience, across different language barriers, and feel confident that they’ll be understood instantly.
This is becoming increasingly important as businesses become more and more geographically dispersed. With different languages and cultures to accommodate, businesses need a universal way to communicate with their employees globally. Visual management enables this to happen.
Visual management promotes transparency
Displaying visual cues that show performance, expectations, standards, or warnings means that information is not hidden. It’s there, in full color, for all to see. This promotes a level of transparency that bridges the gap between management and staff.
I think we can all agree that visual management is an incredibly powerful communication tool to bring into the workplace.
However, as with most things in life, there is a time and place for visual management and it’s easy to get this wrong.
Don’t worry though! Below are three golden rules that’ll help you get it right.
The 3 golden rules of visual management
As we’ve discovered, visual management is regularly used in our everyday lives; from traffic lights and coffee boards, to road signs and car dashboards.
It’s also widely used in the workplace; safety signs, notice boards, performance dashboards, and kanbans are all examples of how visual management is used to communicate key messages to employees.
However, although these types of visual management cues can be incredibly useful for employees to understand what’s going on and what they need to do, organizations can run the risk of over-complicating and over-cluttering their visual management.

“If it’s applied to everything, visual management can easily become overwhelming and difficult to maintain” – KaiNexus, How to avoid 3 Visual Management Mistakes
To make sure this doesn’t happen, there are three simple rules to remember when implementing visual management into your organization.
Visual management rule # 1: Keep it simple
“Simple can be harder than complex: You have to work hard to get your thinking clean to make it simple. But it’s worth it in the end because once you get there, you can move mountains” – Business Insider, The 13 Most Memorable Quotes From Steve Jobs
Imagine you’re on a train and you need to use the bathroom. Above the door to the toilet are thirteen lights stuck onto a pole. Some are flashing; some are solid. Some are red, some are yellow, and some are blue.

What do the lights mean? Why are there so many? What do you do when the lights are flashing? What do you do when they’re solid? What do you do when they’re red? Or blue? Or yellow?!
“Definitions must be clear. If they have to ask, it isn’t visual management it’s just decoration”- 100% Effective, What is Visual Management
It’s too much for you to understand without some form of training or instruction. It’s confusing, overwhelming, and it could be interpreted a thousand different ways (imagine the situations you could find yourself in by misinterpreting the lights…).
The main purpose of visual management is to improve the effectiveness of communication and reaction. So make sure your visual management cues are simple, straight-forward, and easy to understand.
Misunderstandings lead to misdemeanors.
Visual management rule # 2: Use it to help explain complex tasks
Visual management is incredibly effective when describing complex tasks that require a lot of explanation.
Take documenting Standard Operation Procedures (SOPs) for instance. These documents can often turn out to be long, complicated, and dull as dishwater, making it hard for employees to read, let alone understand. So, use images, videos, tables, and charts to simplify instructions and make complicated procedures easy to follow.
Check out this Process Street Standard Operating Procedure (SOP) Template Structure checklist as an example of how we’ve included visual management cues to help explain complicated tasks:
Click here to access the Standard Operating Procedure (SOP) Template Structure!
Visual management rule # 3: Keep it up-to-date & relevant
“People will respond to visualized information as long as it is useful, but they will quickly tune it out when it fails to provide value” – KaiNexus, How to Avoid 3 Visual Management Mistakes
Tell me – what’s worse than out-of-date, irrelevant information?
Nothing. No one has time for that.
Employees will quickly lose faith in your visual management cues if you fail to keep them up-to-date.
Avoid this problem by using something like an online dashboard to communicate with your staff. Online dashboards usually update automatically to provide real-time information and send notifications and warnings to keep tasks moving.
Speaking of online dashboards… have you seen our Process Street checklist dashboard?
Implementing visual management with Process Street
As we’ve discovered, visual management is a great tool for communicating key messages around performance, targets, and company procedures to employees.
You can implement effective visual management into your organization in a thousand different ways; kanbans, notice boards, root cause analysis boards, job trackers…the list is endless.
But most, if not all, of these visual management methods, take time to set-up and embed into your workforce.
What if there was a super-simple way to implement an effective form of visual management, into your organization, right this minute?
Interested?
This is where Process Street can help. Let’s find out a little more about Process Street before I reveal all.
What is Process Street?
Process Street is super-powered checklists. It’s state-of-the-art business process management (BPM) software that allows organizations to create templates and checklists to manage their recurring work in a fun, fast, and faultless way.
Watch this visual cue to find out more:
Templates can be created for any type of workflow or process, from onboarding new staff to managing change within your organization. Individual checklists can be run from each template every time you want to complete a particular workflow or process.
Speaking of change management, and to go back to my earlier promise of more lean management templates, below are three more templates that you can use to make your organization run like a lean, green, well-oiled machine.
VRIO Analysis Checklist
Use this template to assess your resources and capabilities and understand how they’re impacting your business – for better or worse.
Click here to access the VRIO Analysis Checklist!
Gap Analysis Template
Use this gap analysis template to find and fill the gaps between the resources you have and the resources you need to meet your organizational goals.
Click here to access the Gap Analysis Template!
PDCA Cycle Change Management Model Process Checklist
Use this template to make continual improvements to your business processes so they impact your company’s performance ten-fold.
Click here to access the PDCA Cycle Change Management Model Process Checklist!
If these templates don’t fit the bill for your organization or particular process or workflow, then use these extra features to create efficiencies and automate as much of the process as you can:
- Stop tasks
- Dynamic due dates
- Task permissions
- Conditional logic
- Approval tasks
- Embed widget
- Role assignments
Talking of automating processes, you can also connect to thousands of apps through Zapier, webhooks, or API integration to make your workflows super-slick. Take a look at this webinar on business process automation to find out what else you can do to automate your processes.
Ok, so that’s what Process Street is and what we can offer.
Now, let’s get back to how Process Street can help you implement visual management into your organization so you can communicate effectively with your staff, right away.
How Process Street can implement visual management into your organization
“An effective visual management system seeks to display production status and performance information, communicate standards and work instructions, make problems and abnormalities as apparent as possible and show identity and directions” – CI Toolkit, Visual Management
As we know, visual management can be used to visually indicate performance and progress. For instance, it can show you and your employees:
- the tasks that need to be completed
- who needs to complete which tasks
- when tasks need to be completed by
- what order tasks should be completed in
- whether tasks are on-track or behind
This leaves no room for confusion as to what the priorities are and allows everyone to get on with what they need to.
The Process Street checklist dashboard does exactly that.
Check this out:
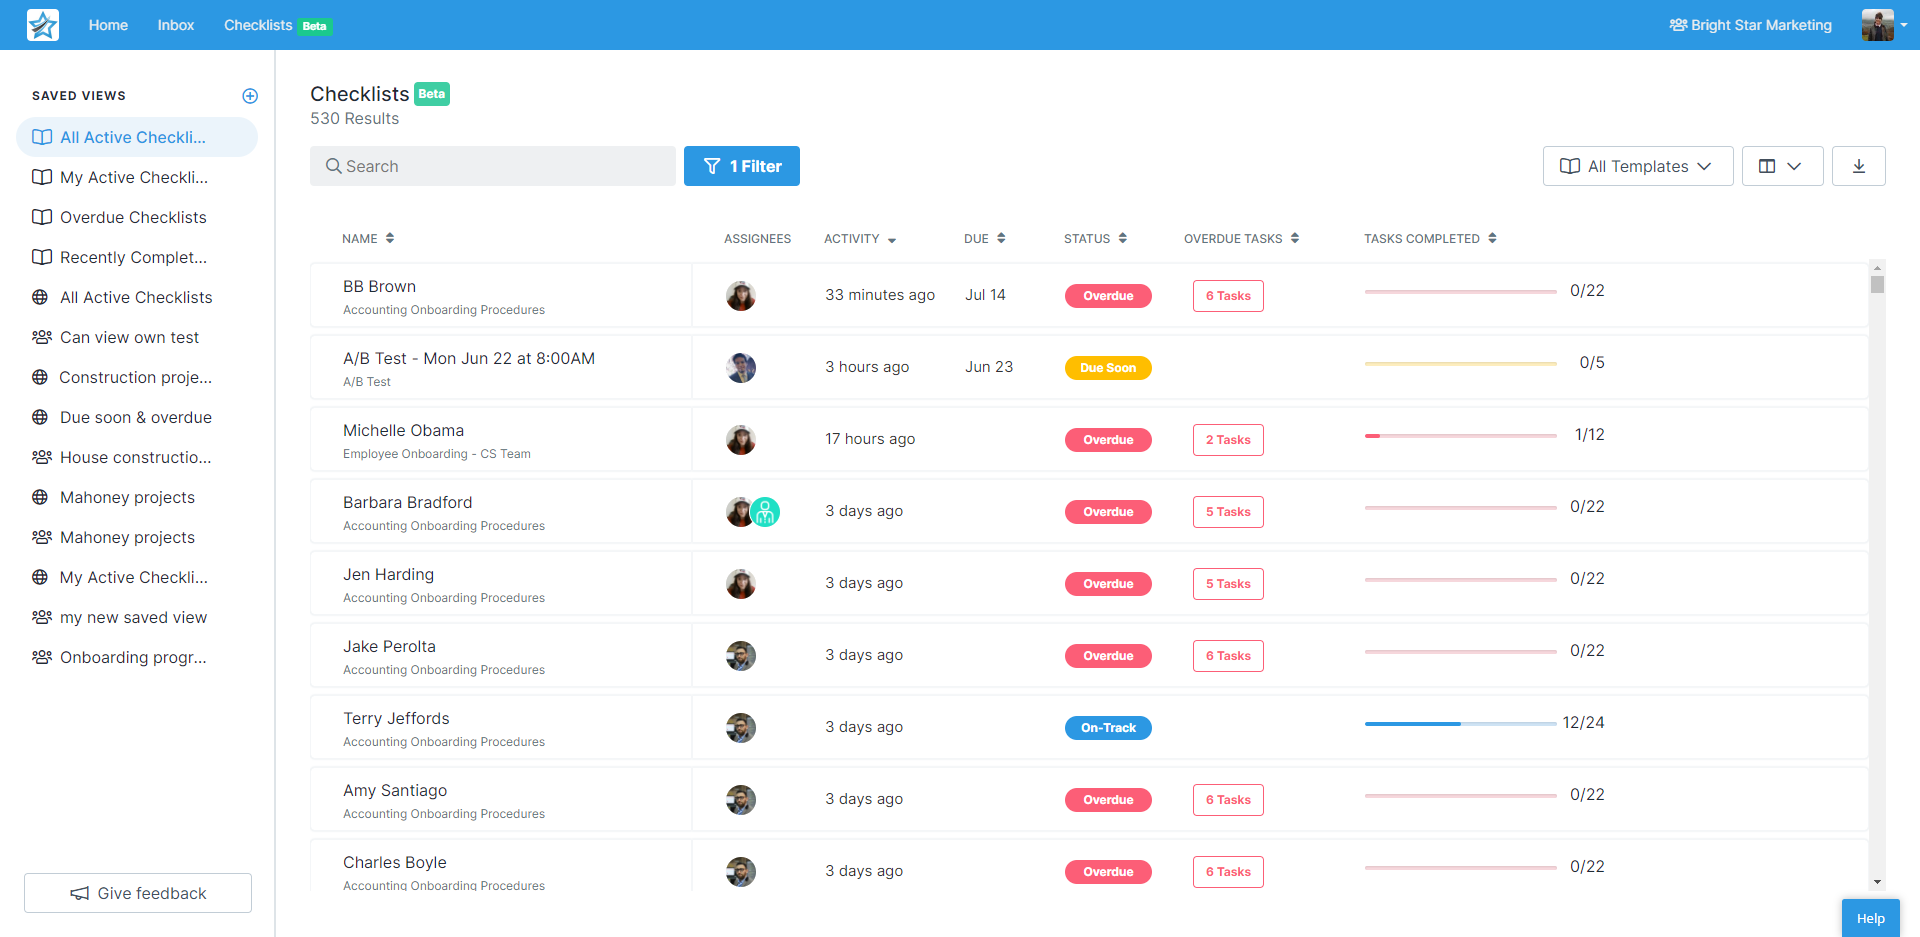
With the use of buttons, icons, mini progress charts, and colors, you can see the current state of your own work, check the status of all relevant tasks and checklists in the business, and track how various teams are performing against targets – with one, quick glance.
Important information is immediately understandable with this simple, concise checklist dashboard. Data is updated in real-time, status notifications are sent where necessary and everyone in the entire company has access to this information.
To start using your checklist dashboard, log into your account, hit “Checklists” in the main navigation, and boom there it is.
If you’re not yet a user, as I mentioned earlier, sign up for a free trial.
You can filter out the information you need to see, change the order it’s displayed in, run reports from the data, and easily keep track of what you and your team need to do.
Cast your eyes over this checklist dashboard post to familiarize yourself with all the features and how it works.
If you’re in the mood for reading, take a look at some of these related articles too.
Visual management related articles
- Are You Poka-Yoke Woke? Stop Mistakes With This Error Prevention Method (10 Examples)
- Choosing a Lean Software Stack: How to Avoid Multiple Systems Chaos
- What is Muda? The 7 Wastes Every Lean Business Needs to Combat
- 9 Lean Manufacturing Principles to Kill the Jargon and Get Quality Results
- How to Start a Lean Process for Continuous Company Learning
- DMAIC: The Complete Guide to Lean Six Sigma in 5 Key Steps
- Kaizen: How to Deploy Continuous Improvement to Rocket Your Success
- Jidoka: Why Automation Plus Intelligence Equals Best Results
- The Future of Lead Generation: Visual Content for an Ultra-Specific Audience
- 10 Tips for Improving Your Small Business Marketing Through Content and Visuals
- 5 Super Tips To Get Valuable Backlinks From Your Visual Content
- Essential Design Tools for Lean Manufacturing
- Lean UX: definition, process & a detailed case study [2019]
And there you have it; how to use visual management to communicate effectively with your staff.
To truly reinforce the effectiveness of visual management, I’ll leave you with this famous, old saying by Arthur Brisbane:

I can’t say more than that.
Oh! Wait! One more thing before I go!
Without looking back, what color was the traffic light on, at the beginning of the post; green or red?
What ways do you use visual management to communicate with your employees? Put your answers in the comments below. Who knows? You may even get featured in an upcoming article!