

Turn every policy into automated workflows with built-in enforcement and audit-ready proof.


System Monitoring Software
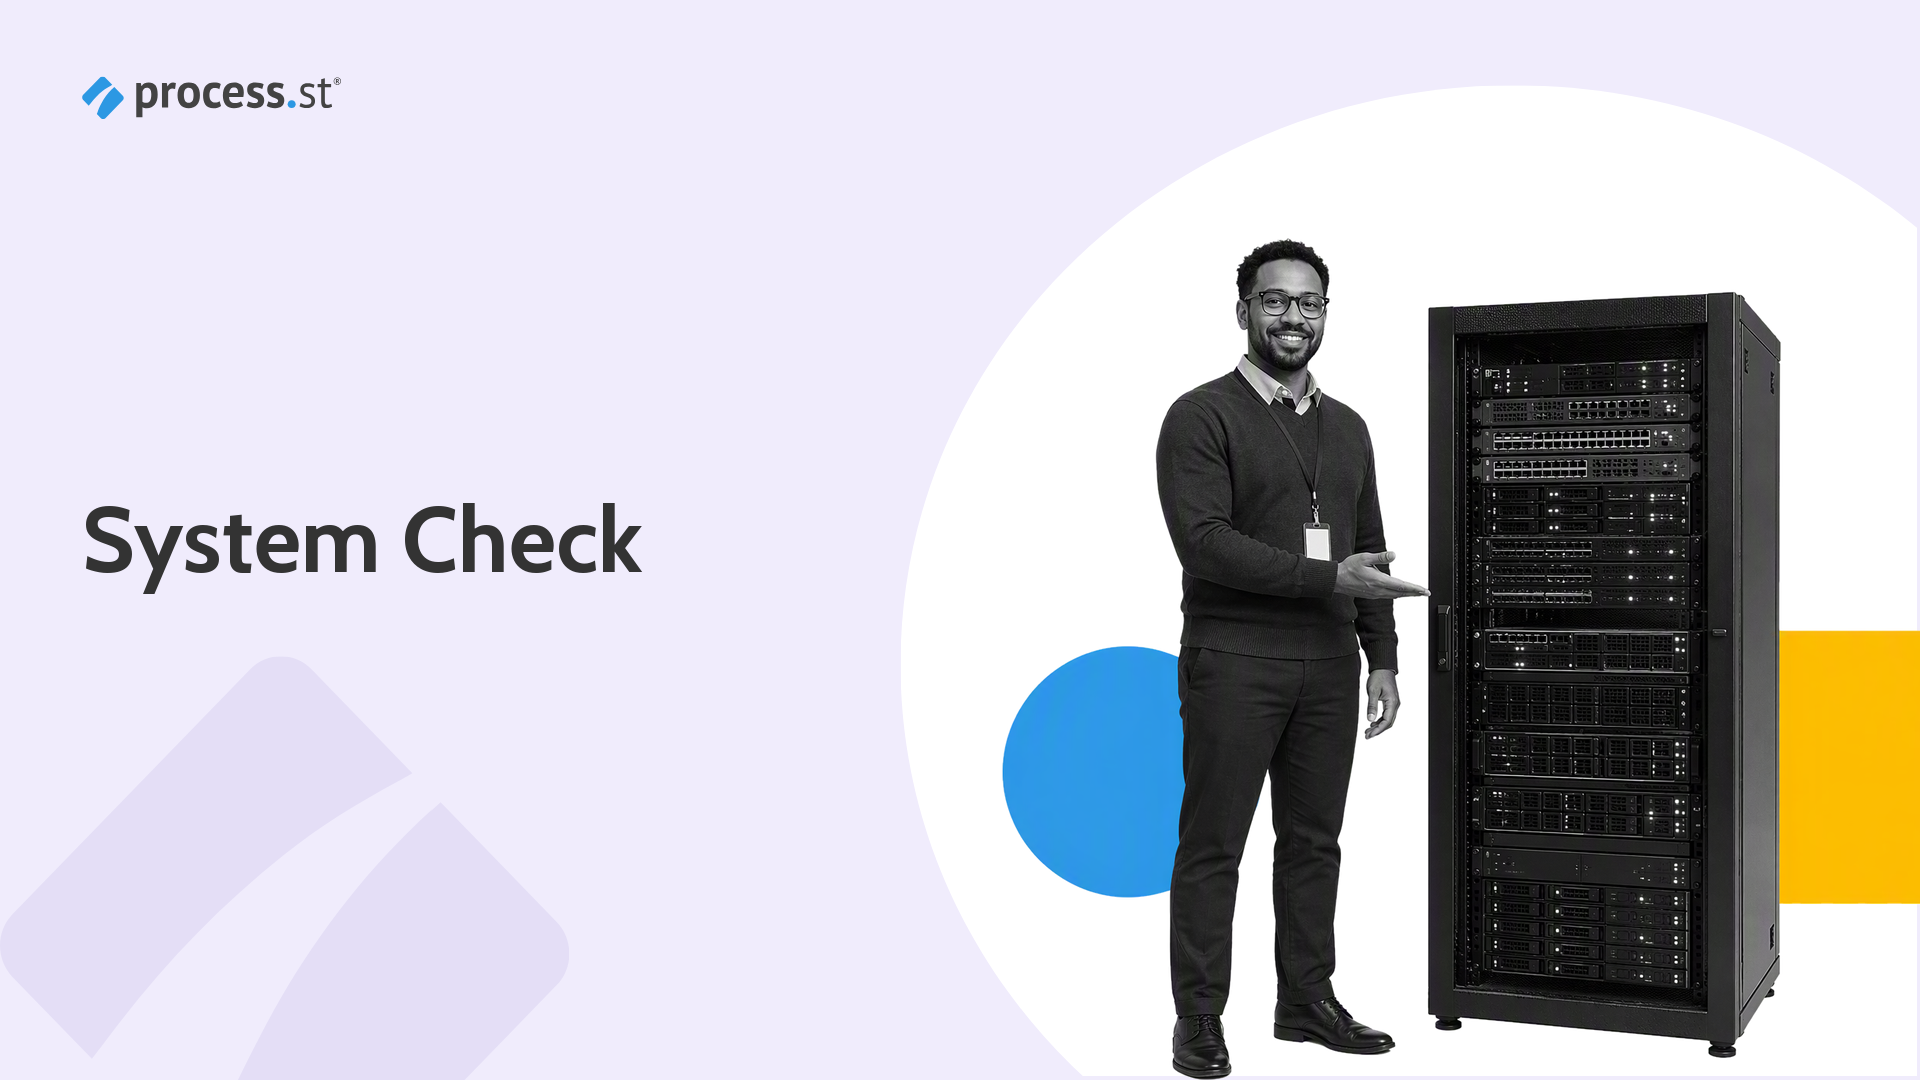
System monitoring software collects and analyzes health signals from infrastructure, networks, applications, databases, cloud services, endpoints, and dependencies. It helps your team detect degraded service, investigate the cause, and respond before a technical fault becomes a larger operational problem.
The useful output is not a wall of charts. A strong monitoring system connects telemetry to an owned service, a meaningful threshold, and a response path. It tells responders what changed, where to investigate, who owns the next action, and what evidence is needed before recovery is confirmed.
This guide explains the category, the signals and coverage that matter, the difference between monitoring and observability, how to evaluate software, and how Process Street turns alerts into controlled, auditable work.
In this guide, we will cover:
- What system monitoring software is
- How system monitoring software works
- What system monitoring software should monitor
- Monitoring, observability, and system management
- How to choose system monitoring software
- How to implement system monitoring software
- Turn monitoring alerts into controlled action
- Common system monitoring failures
- FAQs
What system monitoring software is
System monitoring software is a category of tools that observes the behavior and condition of technology systems. It collects telemetry, compares current behavior with expected behavior, presents system health, and raises alerts when a condition needs attention.
For a wider view of the category, the guide to IT monitoring tools explains how infrastructure, network, application, cloud, and response capabilities fit together.
A service view, not just a device view
Older monitoring programs often started with individual machines: CPU, memory, disk, and network utilization. Those measurements still matter, but modern services span virtual machines, containers, managed databases, queues, APIs, external providers, and user-facing journeys. The monitoring model must connect components to the service they support.
That connection matters because a server can look healthy while a checkout path fails, or a database can remain online while a slow query breaks an important workflow. A service health model translates component signals into operational impact.
Telemetry becomes evidence
Telemetry is the data a system emits about its behavior. Metrics provide numerical measurements over time. Logs record events and context. Traces follow a request across distributed components. Events capture changes such as deployments, scaling actions, or configuration updates. Together, these signals help responders reconstruct what happened.
Detection is only the first job
Monitoring software should help a team detect, investigate, prioritize, route, and learn. Detection without context creates noise. Context without ownership creates an interesting dashboard. Ownership without validation creates premature closure. A complete operating model connects each important alert to a defined response.
How system monitoring software works
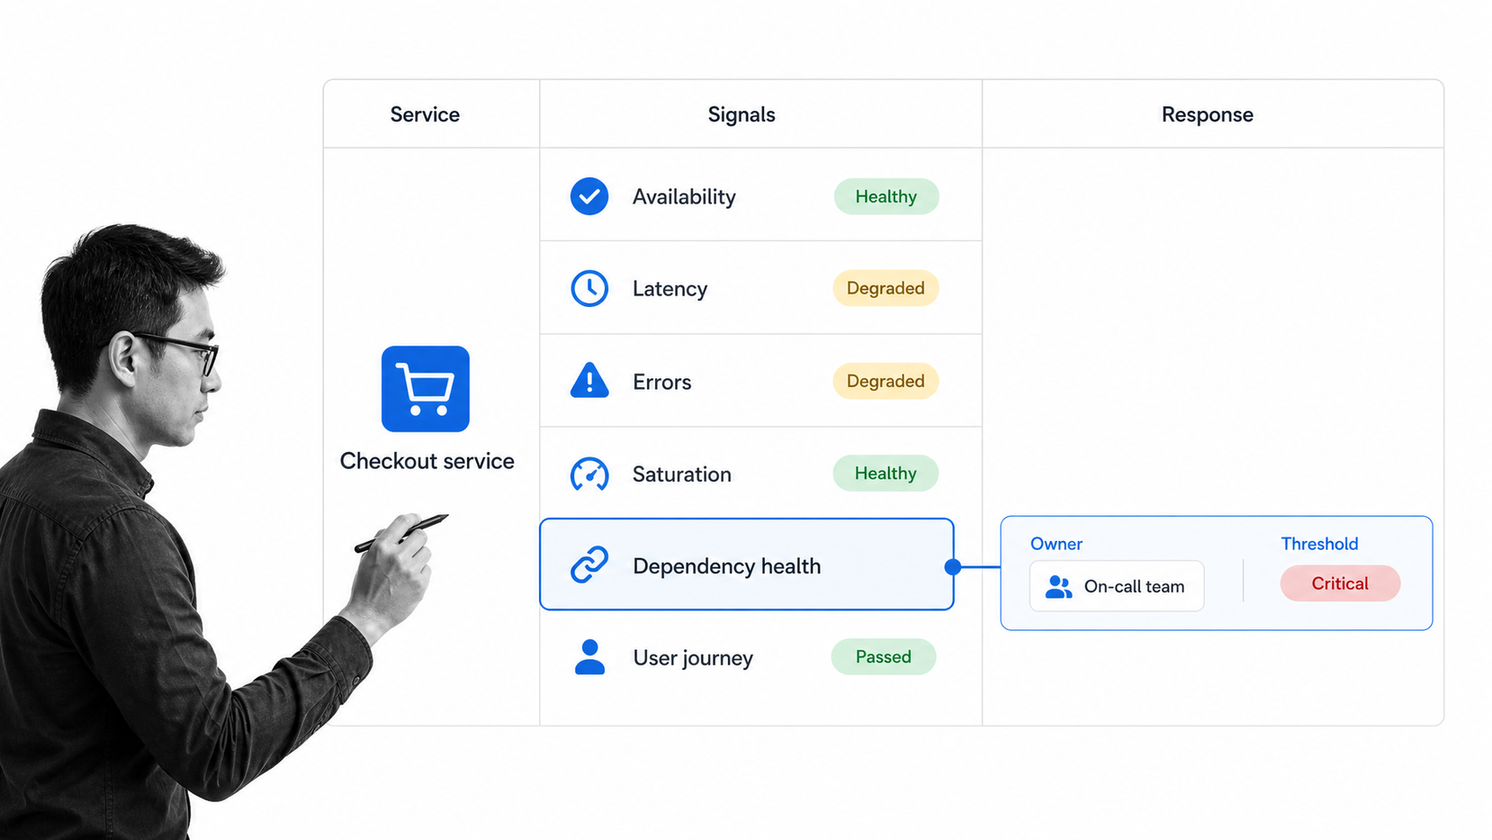
System monitoring software runs as a parallel control layer around production systems. It receives data from agents, collectors, APIs, event streams, and synthetic checks, then turns that data into queryable telemetry, health states, dashboards, and alerts.
1. Instrument and collect
Instrumentation adds the ability to emit useful telemetry. Collection can use a push model, where components send data outward, a pull model, where collectors query targets, or a combination. The right model depends on data type, urgency, connectivity, scale, and whether collection itself could affect the monitored service.
Microsoft describes a monitoring stack as a parallel system that collects metrics, logs, traces, and events from infrastructure and code. Its monitoring architecture guidance also emphasizes aligning telemetry with workload health and business outcomes.
2. Normalize and enrich
Raw telemetry becomes useful when it carries consistent context. Common fields include service, environment, version, region, host, request identifier, customer journey, and deployment. Consistent naming and correlation identifiers let responders move from a high-level symptom to the supporting logs or traces without rebuilding the timeline manually.
3. Store and query
Different signals have different storage and access patterns. Alerting data needs fast access. High-volume logs may need tiered retention. Traces may be sampled. Security or audit evidence may need stricter access and longer retention. Good software makes these tradeoffs visible before ingestion cost or query delay becomes a surprise.
4. Model health and dependencies
A health model relates component measurements to services and user journeys. It should show dependencies, define acceptable states, and identify which signals indicate degradation. This is how a team avoids treating every host metric as equally important.
5. Detect and alert
Detection can use static thresholds, dynamic baselines, anomaly models, absence checks, composite conditions, or service-level objectives. An alert should indicate a condition that requires action. If no one can name the action, the signal may belong on a dashboard or review report instead of an on-call page.
Google SRE guidance on practical alerting reinforces the value of time-series data and purposeful alert rules. The operational standard is simple: alert on conditions that matter and keep enough context to investigate them.
What system monitoring software should monitor
Coverage should follow critical services and failure modes. A team rarely needs every possible signal on day one. It needs enough trustworthy evidence to detect customer impact, isolate likely causes, and validate recovery.
Infrastructure and operating systems
Monitor compute, memory, storage, processes, operating system events, virtualization, containers, and capacity. Resource saturation is important, but it should be interpreted with workload behavior. High utilization can be normal. A failed user journey at normal utilization can still be urgent.
A recurring server maintenance workflow connects detected risks to patching, backups, validation, and maintenance evidence.
Networks and connectivity
Track device health, interface errors, throughput, latency, packet loss, DNS, routing, and path availability. Map network signals to the services and locations they affect. Use a network security audit workflow to review controls, access, configurations, and event evidence on a repeatable schedule.
Applications and APIs
Application monitoring follows request rates, error rates, latency, transactions, queues, dependencies, and important code paths. API monitoring should test availability, correctness, authentication, response time, and downstream dependencies. A single uptime check cannot explain why a distributed request failed.
Databases and data services
Monitor connections, query latency, locks, replication, storage, cache behavior, failed jobs, and backup state. Database health must be tied to the applications and journeys that depend on it. A technically available database can still be the source of user-facing degradation.
Cloud and container platforms
Cloud monitoring needs account, region, resource, tag, cluster, namespace, service, and autoscaling context. Ephemeral resources make manual inventory unreliable. Coverage should update as infrastructure changes, while permissions and telemetry collection remain controlled.
The Amazon CloudWatch documentation shows the breadth of a modern monitoring surface across infrastructure, applications, logs, metrics, traces, networks, alarms, and dashboards.
Logs, traces, and events
Centralized logs make events searchable across components. Distributed traces connect spans into a request path. Change events explain what was deployed or configured before behavior shifted. The OpenTelemetry signal model provides a vendor-neutral language for traces, metrics, and logs.
Teams that need a deeper category review can use the guide to log management tools to evaluate collection, search, retention, access, and operational handoffs.
Synthetic checks and user experience
Synthetic monitoring runs controlled tests against important endpoints and journeys. Real-user monitoring captures actual session performance. Both reveal failures that component metrics can miss. Pair production monitoring with load testing to test expected and extreme demand before customers find the limit.
Monitoring, observability, and system management
Monitoring, observability, and system management overlap, but they are not interchangeable. Clear boundaries help teams buy the right capabilities and design a complete operating model.
Monitoring answers known health questions
Monitoring checks selected signals and conditions. It is excellent for known failure modes: an endpoint is unavailable, latency exceeds a threshold, disk space is low, or a queue is growing. Teams define what to watch and what response should follow.
Observability supports open-ended investigation
Observability describes how well a team can understand internal system state from emitted data. It helps responders ask new questions during unfamiliar failures. Rich context, consistent fields, traces, and dependency maps make open-ended investigation possible.
System management changes the environment
System management includes configuration, patching, provisioning, access, inventory, and remote administration. Monitoring detects and explains conditions. Management changes the system. The existing system management software guide covers that broader administrative category, while remote management tools focuses on distributed device oversight and administration.
Workflow monitoring checks the response
Technical monitoring watches the technology. Workflow monitoring checks whether the response process is moving: who owns the task, what is blocked, which approval is waiting, and whether required evidence is complete. Reliable operations need both views.
How to choose system monitoring software
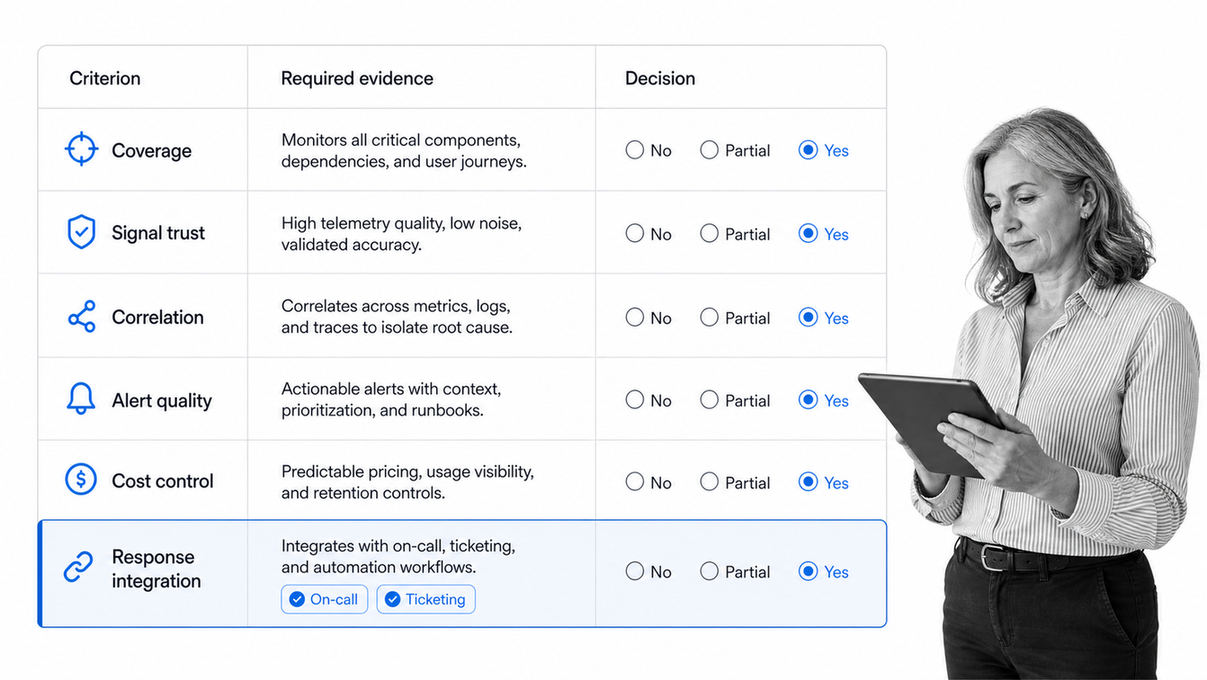
Choose software from the service and response requirements backward. Feature grids encourage teams to buy broad capability without confirming signal quality, operating cost, ownership, or incident fit. A realistic pilot should prove the complete path from telemetry to validated recovery.
Define the monitored services
List critical services, user journeys, dependencies, environments, operating hours, owners, and reliability targets. Decide which failures create customer, security, compliance, or financial risk. This establishes the coverage boundary and keeps the evaluation grounded.
Test coverage and deployment fit
Confirm how the software collects from operating systems, networks, applications, databases, cloud services, containers, endpoints, and external dependencies. Review agent support, permissions, firewall needs, resource overhead, automation options, and how coverage adapts when infrastructure changes.
Evaluate signal trust
Test timestamps, labels, missing data, sampling, cardinality, clock alignment, duplicate events, and query behavior. Responders must trust the data during an incident. A wide data catalog is not useful if the team cannot tell whether a gap represents healthy silence or failed collection.
Inspect correlation and investigation
Start with a realistic symptom and trace the investigation. Can the operator move from a service health change to related metrics, logs, traces, deployments, and dependencies? Can the platform preserve the timeline and share the investigation without copying evidence across multiple tools?
Measure alert quality
Test routing, grouping, deduplication, suppression, maintenance windows, escalation, and service-aware thresholds. Measure false positives, missed conditions, duplicate pages, and how often an alert leads to a useful action. More alerts are not better monitoring.
Model total operating cost
Include telemetry volume, retention, high-cardinality metrics, trace sampling, log indexing, data transfer, agents, upgrades, dashboards, and administrative labor. Cost controls should be visible to the teams creating telemetry, not discovered after a billing spike.
Verify the response handoff
Ask what happens after the alert. Can the condition create an owned response, carry service and severity context, require evidence, route approvals, coordinate communication, and validate recovery? The guide to incident management tools helps evaluate that response layer separately from raw monitoring.
How to implement system monitoring software
Implement system monitoring software one service at a time. A broad rollout can create hundreds of monitors without producing a trustworthy service view. A focused rollout proves collection, health logic, ownership, response, and review before the model expands.
1. Inventory services and dependencies
Create a service inventory with owners, environments, components, data stores, third-party dependencies, and critical journeys. Include manual operating dependencies such as approvals and vendor response. A technical architecture map without ownership is incomplete.
2. Define health and reliability targets
Name the outcomes that represent health. Examples include successful transactions, available endpoints, acceptable latency, correct job completion, and recovered capacity. Set targets that reflect user and business impact, then connect supporting component signals.
3. Establish telemetry standards
Define naming, labels, environments, service identifiers, correlation fields, severity, time synchronization, sensitive-data handling, and ownership. Standardization makes cross-service analysis possible and reduces the need for one-off dashboards and queries.
4. Build dashboards for decisions
Each dashboard should serve an audience and decision. A service owner may need health, errors, latency, dependencies, and recent changes. An executive view may need availability, customer impact, open incidents, and risk trends. Remove panels that do not influence action.
5. Design alert policy
For each alert, define severity, owner, expected action, escalation timer, supporting context, evidence requirement, and closure rule. Use maintenance windows and grouping to avoid predictable noise. Put lower-risk conditions into review queues instead of paging someone immediately.
6. Create response workflows
Use an information security incident response workflow for security events and an IT change management process when remediation changes production. Structured response makes ownership, approval, evidence, and rollback explicit.
7. Test detection and recovery
Run controlled failure exercises. Verify that telemetry arrives, health changes correctly, alerts route to the expected owner, investigation context is accessible, and recovery can be validated. A disaster recovery checklist helps test restoration and communication instead of assuming the plan works.
8. Govern retention and access
Set retention by data type and purpose. Protect secrets, personal data, and sensitive system details. Limit who can change collectors, mute alerts, edit thresholds, or delete evidence. NIST guidance on information security continuous monitoring connects monitoring strategy to risk, response, and ongoing assessment.
9. Review the monitoring system
Measure missed incidents, false positives, duplicate alerts, stale dashboards, broken collectors, unowned services, slow handoffs, and monitors that never influence a decision. Add the smallest signal that would have changed a missed outcome. Fix or retire signals that create repeated noise.
A patch management plan provides a controlled path when monitoring exposes unstable or vulnerable software that needs testing, deployment, validation, and follow-up.
Turn monitoring alerts into controlled action
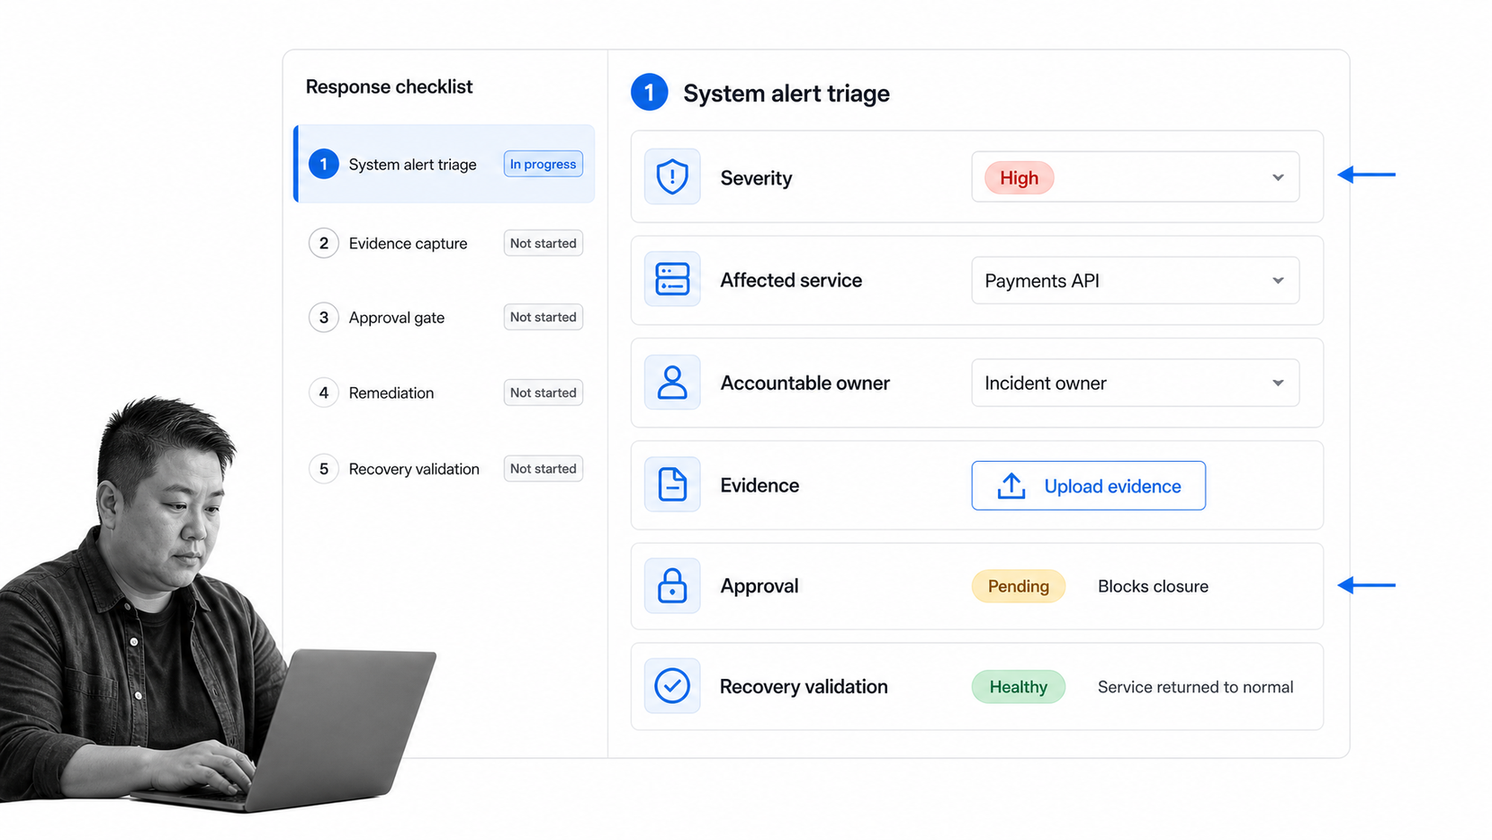
System monitoring software detects technical conditions. Process Street extends that detection by turning an alert into an executable response. The monitoring platform remains the source of telemetry. The workflow becomes the controlled record of ownership, decisions, remediation, evidence, approval, and recovery.
Standardize alert intake
A response workflow can capture alert source, affected service, environment, severity, customer impact, current owner, and initial evidence in a consistent format. This reduces the time lost translating an alert into work and makes response records comparable.
Route work by risk and service
Conditional logic can show the right tasks and fields for severity, service, environment, or incident type. The conditional logic documentation explains how workflows adapt based on form responses and task state.
Require evidence before closure
Required fields, file uploads, stop tasks, and approvals can prevent a response from closing before investigation and validation are complete. Teams can configure single or sequential approval tasks for remediation, recovery, and post-incident review.
Coordinate the surrounding systems
Process Street has direct, universal integrations to 5,000+ systems. Need a new one? An AI agent builds it on the fly. A monitoring event can start a workflow, and the workflow can coordinate communication, ticketing, evidence, approvals, and follow-up across the stack.
Preserve an audit trail
Task history, field values, comments, evidence, approvals, and completion state stay attached to the workflow run. This makes operational reviews faster and gives compliance, security, and service owners a clear record of what happened.
Monitor the response itself
A technical alert can be accurate while the response still fails. Use checklist monitoring to confirm that triage, communication, remediation, validation, and improvement steps are completed with the required proof.
Common system monitoring failures
Monitoring components without services
A set of green host charts can hide a broken user journey. Organize signals around services and outcomes, then retain component detail for diagnosis.
Collecting data without ownership
Every important service, monitor, dashboard, alert rule, and collector needs an owner. Shared responsibility often becomes no responsibility when conditions change.
Paging on every anomaly
Unexpected behavior is not always urgent. Page when the condition requires immediate action. Route lower-risk signals into review queues and tune anomaly rules against real operating patterns.
Ignoring telemetry cost
Unbounded labels, verbose logs, long retention, and full trace capture can increase cost quickly. Set standards and budgets before teams instrument every possible detail.
Closing without validation
A cleared alert does not prove the service recovered. Validate the user journey, dependent systems, monitoring coverage, and remediation result before closure. Record the evidence with the response.
Keeping stale monitors forever
Applications, infrastructure, ownership, and risk change. Review monitors after architecture changes and incidents. Remove obsolete checks, repair blind spots, and keep alert policy aligned with current services.
FAQs
What is system monitoring software?
System monitoring software collects and analyzes health signals from infrastructure, networks, applications, databases, cloud services, endpoints, and dependencies. It helps teams detect degraded service, investigate likely causes, and trigger an appropriate response.
What does system monitoring software monitor?
It can monitor availability, latency, errors, saturation, resource use, processes, logs, traces, network paths, databases, APIs, cloud resources, deployments, dependencies, and user journeys. Coverage should follow critical services and failure modes rather than every possible metric.
What is the difference between monitoring and observability?
Monitoring checks selected signals and known conditions so teams can detect expected failure modes. Observability describes how well teams can understand internal system state from emitted telemetry, including investigating failures they did not predict in advance.
How do you choose system monitoring software?
Start with critical services, dependencies, failure modes, owners, and response requirements. Then test coverage, signal trust, correlation, alert quality, deployment fit, total operating cost, and the complete handoff from detection to validated recovery.
How should teams implement system monitoring software?
Implement one important service at a time. Define health, standardize telemetry, instrument the service, test alerts and response workflows, govern access and retention, run controlled failure exercises, and review monitoring quality on a regular cadence.
Can Process Street replace system monitoring software?
No. Process Street does not replace infrastructure, application, network, or observability telemetry. It complements system monitoring software by turning alerts into structured response workflows with ownership, evidence, approvals, automation, recovery validation, and an audit trail.