

Turn every policy into automated workflows with built-in enforcement and audit-ready proof.


IT Monitoring Tools
IT monitoring tools collect signals from infrastructure, networks, applications, cloud services, and user-facing systems so teams can detect unhealthy conditions before they become prolonged outages or security incidents.
The useful part is not the dashboard. It is the operating loop behind it: collect trustworthy signals, define meaningful thresholds, route actionable alerts, investigate with enough context, and confirm that the response was completed.
This guide explains what to monitor, the main monitoring categories, how to evaluate coverage, and how Process Street can turn technical alerts into owned, repeatable, auditable response workflows. It does not rank vendors or pretend one product should cover every layer of a modern stack.
In this article, we will cover:
- What IT monitoring tools do
- What IT monitoring tools should cover
- The main categories of IT monitoring tools
- How to choose IT monitoring tools
- How to implement IT monitoring tools
- How Process Street extends IT monitoring tools
- Common IT monitoring mistakes
- FAQs
What IT monitoring tools do
Monitoring starts with a model of normal behavior. A tool collects measurements, events, logs, traces, and dependency data, then compares current behavior with thresholds, baselines, or service objectives. When the system detects a meaningful deviation, it creates an alert or another machine-readable event.
Collect telemetry
Telemetry is data emitted by a system while it runs. OpenTelemetry defines a metric as a runtime measurement, while logs describe discrete events and traces follow a request across connected services. Strong monitoring combines these signals instead of treating each stream as a separate truth.
Build a current state
Raw telemetry becomes useful when the tool organizes it around services, hosts, dependencies, user journeys, or business-critical transactions. That current state lets an operator ask whether a service is available, whether performance is degrading, and which dependency changed at the same time.
Detect conditions that need attention
A threshold is a rule that decides when a signal deserves attention. Good thresholds map to impact. Google SRE guidance emphasizes monitoring that supports rational decisions and high-level service objectives, while retaining enough detail for investigation. That is a better target than paging on every single component failure. See Google SRE guidance on practical alerting.
Support diagnosis and response
An alert should carry enough context to start an investigation: affected service, signal, severity, recent changes, related events, and a route to the responsible owner. The monitoring platform may detect the condition, but the response still needs a governed process.
What IT monitoring tools should cover
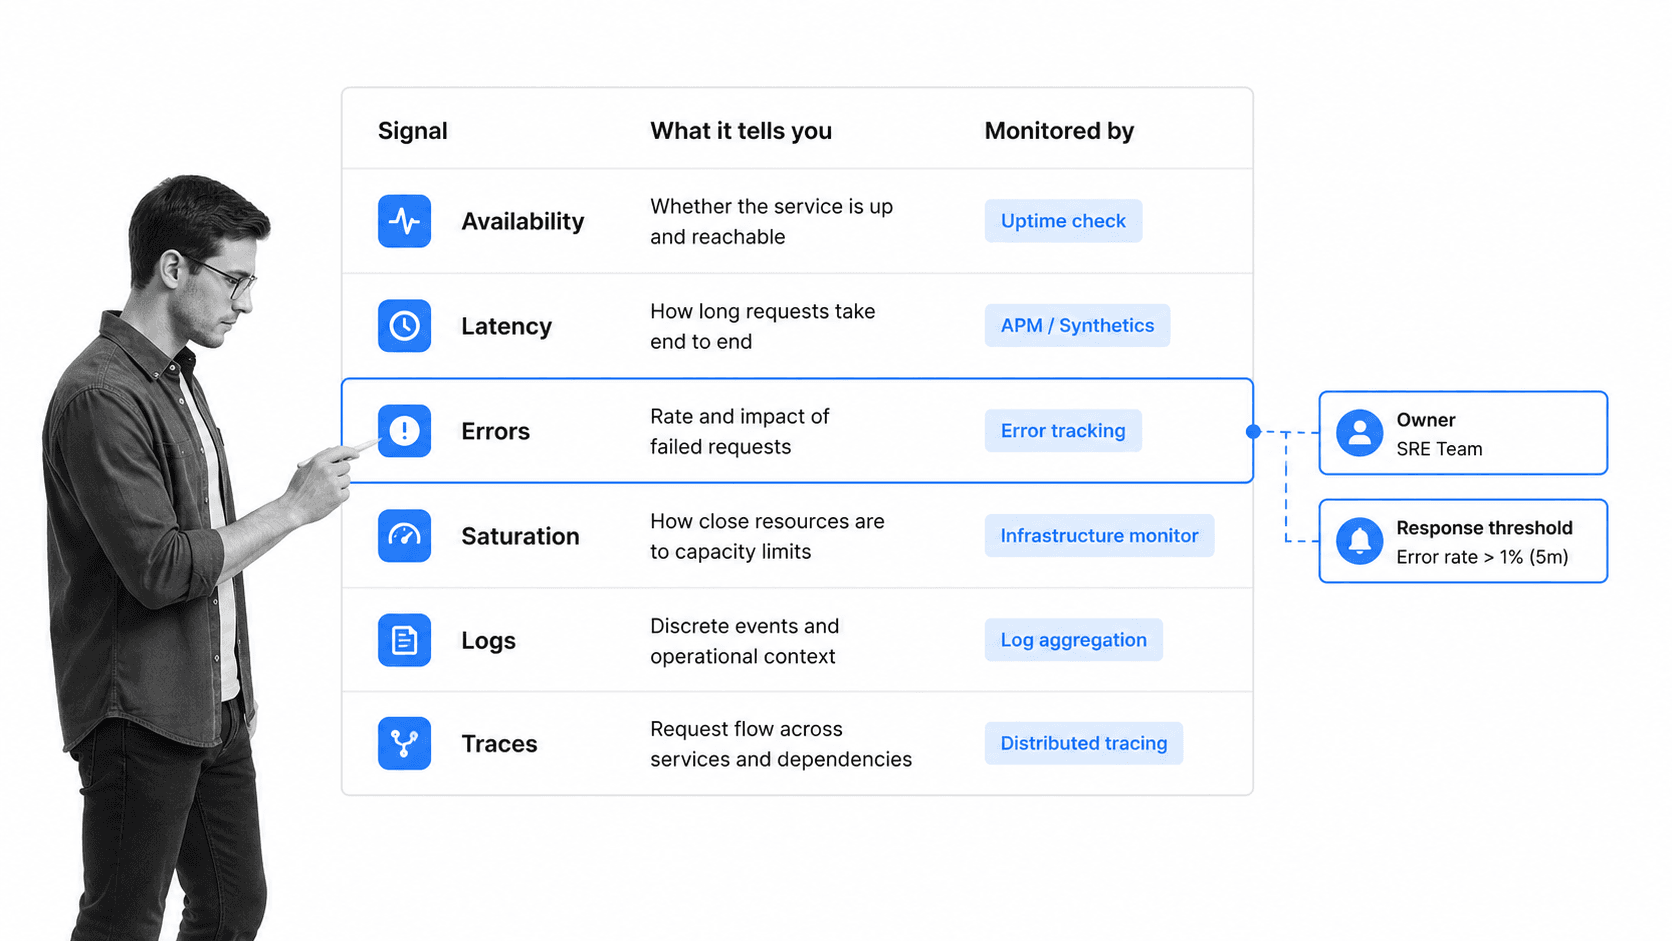
Coverage should follow the path a user request takes through the stack. If monitoring stops at server health, a team can miss a broken customer journey. If it only checks the front end, it can miss the dependency that caused the failure.
Availability
Availability checks whether a service can perform its intended job. Use external checks for the user-visible path and internal checks for component health. A green host does not prove that checkout, authentication, or data synchronization is working.
Latency
Latency measures how long work takes. Track distributions and high-percentile behavior, not just averages. A normal average can hide a slow tail that affects a meaningful slice of users or an important batch process.
Errors
Error monitoring should distinguish expected failures from conditions that threaten a service objective. Group errors by service, operation, customer impact, and recent change. Avoid alerts that merely repeat a log line without explaining impact.
Saturation and capacity
Saturation shows how close a constrained resource is to its practical limit. CPU, memory, disk, queue depth, connection pools, and rate limits can all matter. The useful question is not whether utilization is high, but whether remaining capacity threatens the service.
Logs and event records
Logs provide investigation detail and evidence. A dedicated guide to log management tools explains collection, retention, search, and review. For security programs, NIST guidance on continuous monitoring connects ongoing visibility with timely risk response.
Traces and dependencies
Distributed tracing follows a request across services and exposes where time or errors accumulate. Dependency mapping helps operators see whether the source is the application, network, database, third-party service, or a recent deployment.
Operational response
Technical coverage is incomplete without ownership. Connect alerts to an incident management process that records severity, assigns responsibility, preserves evidence, manages communication, and confirms recovery.
The main categories of IT monitoring tools
The category is broad because the IT environment is broad. Most teams use a stack of specialized capabilities rather than one universal product. Start with the risks and services that matter, then choose the layers that provide the necessary evidence.
Infrastructure monitoring
Infrastructure monitoring watches servers, virtual machines, containers, storage, operating systems, and cloud resources. It helps teams understand resource health, capacity, and availability. Pair it with a recurring server maintenance checklist so detected issues lead to controlled maintenance work.
Network monitoring
Network monitoring tracks device health, throughput, latency, packet loss, interface errors, and path behavior. It supports capacity planning and troubleshooting across local, wide-area, wireless, and cloud networks. A network security audit workflow adds a repeatable review of procedures, patches, access points, and event logs.
Application performance monitoring
Application performance monitoring follows transactions through application code and dependencies. It usually combines request timing, errors, traces, and service maps to explain why a user-facing path slowed or failed.
Cloud monitoring
Cloud monitoring adds dynamic resources, managed services, tags, accounts, regions, and autoscaling behavior. The evaluation challenge is not merely whether a tool supports a cloud provider. It is whether the team can organize signals around owned services and keep cardinality, cost, and alert volume under control.
Log monitoring and security monitoring
Log monitoring searches event streams for operational and security conditions. Security monitoring adds threat detection, control status, investigation, and evidence needs. CISA describes standardized response processes that identify, coordinate, remediate, recover, and track mitigations. See the CISA incident response overview.
Synthetic and user-experience monitoring
Synthetic monitoring runs controlled checks against important journeys. Real-user monitoring measures actual user sessions. Both complement load testing, which evaluates behavior under expected and extreme demand before production traffic exposes a weakness.
Remote monitoring and management
Remote monitoring and management supports distributed endpoints and remote administration. Teams evaluating this layer can use the broader guide to remote management tools to connect device oversight with recurring maintenance and support work.
How to choose IT monitoring tools
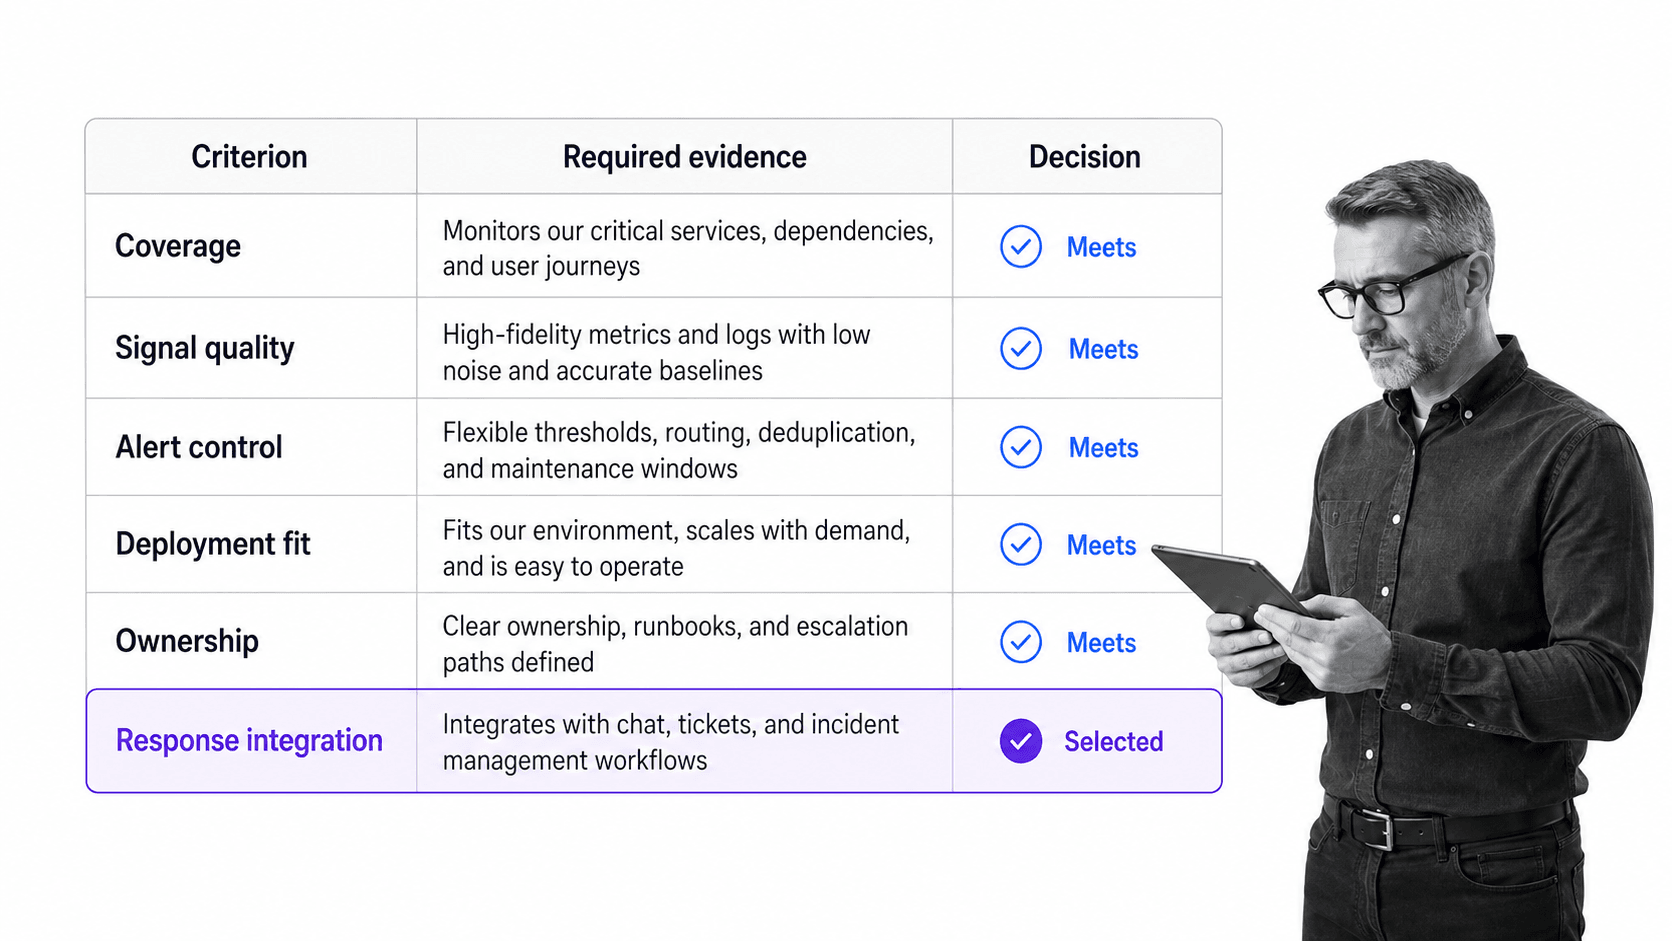
Choose from the service backward, not from the feature list forward. A useful shortlist starts with critical journeys, failure modes, response owners, and evidence needs. Product breadth only matters when it maps to those jobs.
Define the monitored service
Name the service, users, dependencies, operating hours, and acceptable failure boundaries. Decide which conditions deserve a page, a ticket, a scheduled review, or no action. This prevents every metric from becoming an urgent alert.
Map signal coverage
List the metrics, logs, traces, network paths, cloud resources, and user journeys needed to explain service health. Identify collection gaps and unsupported dependencies before evaluating dashboards or AI features.
Test signal quality
A tool should collect consistent, timely, well-labeled data. Test high-cardinality behavior, clock alignment, missing data, sampling, retention, and query performance. A tool with wide coverage can still be weak if operators do not trust its data during an incident.
Evaluate alert control
Look for routing, grouping, suppression, maintenance windows, escalation, ownership, and service-aware thresholds. Measure whether the tool reduces noise in a realistic pilot. More alerts are not better monitoring.
Check deployment and operating cost
Consider agents, collectors, cloud permissions, network access, data volume, retention, and administration. Include the human cost of tuning, upgrades, dashboard upkeep, and integration maintenance.
Inspect the response handoff
Ask what happens after detection. Can the alert create an owned workflow, attach context, require evidence, route approvals, trigger communications, and close with a review? This is where monitoring connects to operating discipline rather than ending at notification.
How to implement IT monitoring tools
Implementation works best as a service-by-service rollout. Start with one important service, establish trustworthy signals, prove the response loop, then expand. A broad installation without ownership usually creates dashboards faster than it creates reliability.
1. Inventory services and dependencies
Create a service inventory with owners, environments, dependencies, and critical user journeys. Include third-party systems and manual operating processes, not only technical components.
2. Establish a baseline
Collect normal behavior before setting aggressive thresholds. Capture daily and weekly patterns, planned batch loads, maintenance windows, and deployment effects. Baselines help distinguish normal variation from risk.
3. Define alert policy
For each alert, define severity, owner, expected action, escalation timer, evidence requirement, and closure rule. If no action exists, the signal may belong on a dashboard or review report instead of an alert channel.
4. Build response workflows
Use an information security incident response workflow for security events and an IT change management process for remediation that changes production systems. Both keep responsibility, approvals, and evidence explicit.
5. Test detection and recovery
Run controlled failure exercises. Verify that signals appear, alerts route correctly, owners can access the necessary context, and recovery steps work. A disaster recovery checklist helps teams test restoration, communication, and improvement work instead of assuming a plan will work.
6. Review and tune
Review false positives, missed incidents, slow handoffs, and repetitive manual steps. Use a patch management plan when monitoring exposes vulnerable or unstable software that needs controlled testing, deployment, validation, and follow-up.
7. Assign ownership for monitoring quality
Monitoring needs an owner after the initial rollout. Assign responsibility for collectors, dashboards, alert rules, service maps, and response integrations. The service owner should confirm that coverage still represents the user journey, while the operations owner should check whether alerts remain actionable. Record who can change thresholds, who approves major routing changes, and who reviews disabled monitors. Clear ownership prevents a familiar failure pattern where everyone depends on a monitor but nobody maintains it. Include monitoring changes in normal change control so a revised threshold, muted alert, or retired collector has a reason, reviewer, test result, and rollback path.
8. Plan retention, access, and evidence
Decide how long each signal must remain available and who should be able to inspect it. High-volume telemetry may need shorter operational retention, while security events, incident evidence, and change records may follow different requirements. Define access by role, protect sensitive log fields, and test whether responders can retrieve the evidence they need during an incident. Retention should support investigation without collecting data indefinitely by default. Document the relationship between the monitoring record and the response record so teams know where to find raw signals, decisions, approvals, remediation proof, and validation results. That separation makes reviews faster and reduces the chance that critical evidence disappears inside an alert channel.
9. Measure the monitoring system itself
Track whether monitoring improves detection and response, not just how many signals it collects. Useful review questions include whether important failures were detected, whether alerts reached the correct owner, whether responders had enough context, and whether recovery was independently validated. Examine false positives, missed conditions, duplicate alerts, stale dashboards, and monitors that never influence a decision. Review these findings after incidents and on a regular operating cadence. When a monitor creates repeated noise, fix or retire it. When an incident exposes a blind spot, add the smallest signal that would have changed the outcome. This keeps the monitoring stack aligned with real services instead of allowing it to grow as an unmanaged collection of dashboards and rules.
How Process Street extends IT monitoring tools
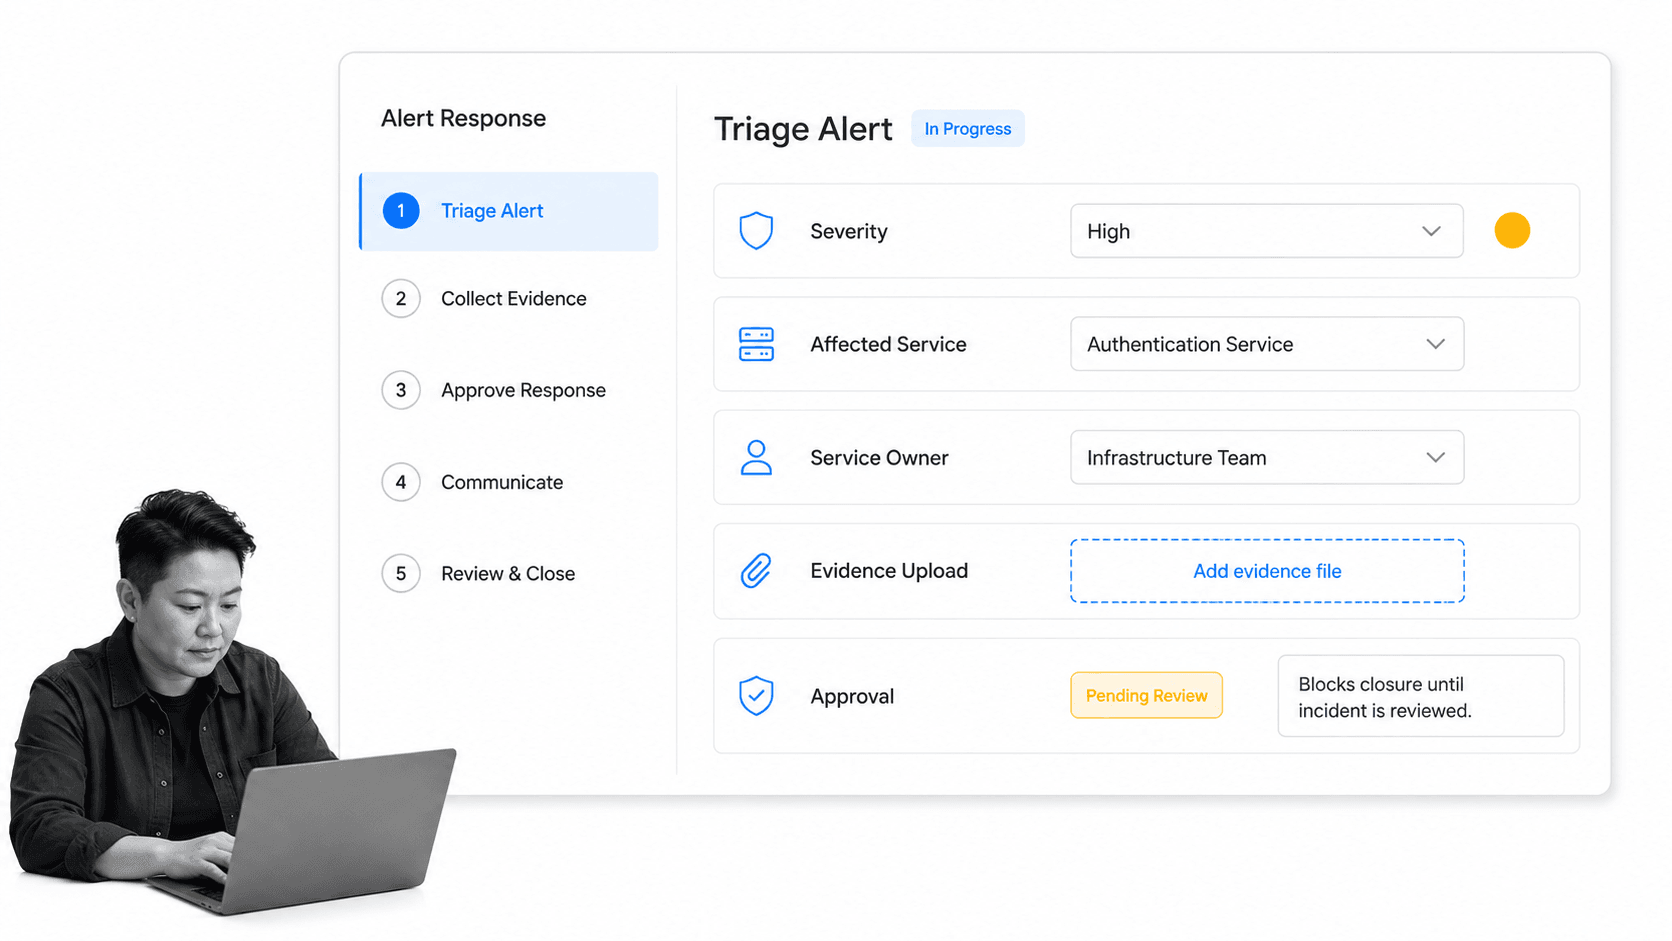
Process Street does not replace infrastructure, network, application, cloud, or security telemetry. It extends IT monitoring tools by turning detected conditions into controlled work. The monitoring platform answers what changed. The response workflow makes sure the right people act, prove what they did, and close the loop.
Create a consistent alert intake
A workflow can capture the affected service, severity, alert source, initial evidence, owner, and customer impact in a consistent format. This reduces the time lost translating alerts into work.
Route work by severity and service
Conditional logic can show the right tasks and fields based on severity, service, or incident type. The conditional logic documentation shows how workflow content and tasks can adapt to form responses and task state.
Require approvals and evidence
Required fields, file uploads, stop tasks, and approvals can prevent premature closure. Teams can configure single, multi-stage, or sequential approval tasks for changes, recovery, and post-incident review.
Connect the monitoring stack
Process Street has direct, universal integrations to 5,000+ systems. Need a new one? An AI agent builds it on the fly. That lets a monitoring event start a workflow, while workflow actions coordinate the systems and people involved in the response.
Preserve an audit trail
Task history, field values, comments, evidence, approvals, and completion state stay attached to the workflow run. This creates a usable record for operational reviews, compliance checks, and recurring problem analysis.
Monitor the response process
Technical monitoring and workflow monitoring answer different questions. The first watches system health. The second checks whether people and automations completed the response correctly. A guide to workflow monitoring explains how to track owners, timing, exceptions, evidence, and outcomes inside repeatable work.
Common IT monitoring mistakes
Monitoring components without services
A wall of host metrics can stay green while a critical user journey fails. Organize monitoring around owned services and outcomes, then retain component detail for diagnosis.
Paging on every anomaly
Anomaly detection can surface unexpected behavior, but unexpected does not always mean urgent. Page when impact or risk requires immediate action. Route lower-risk signals into review queues.
Ignoring response ownership
An alert sent to a crowded channel is not an assigned action. Every urgent condition needs a named owner, escalation timer, and closure rule.
Closing alerts without proof
Require investigation notes, remediation evidence, validation, and review for important incidents. Checklist monitoring is useful when teams need to verify that every response step and required artifact is present before closure.
Keeping noisy monitors forever
Monitoring is a product that needs maintenance. Retire unused checks, revise thresholds after architecture changes, and review whether each alert still leads to a useful decision.
FAQs
What are IT monitoring tools?
IT monitoring tools collect and analyze signals from infrastructure, networks, applications, cloud services, logs, and user journeys. They help teams detect unhealthy conditions, investigate causes, and trigger an appropriate response.
What should IT monitoring tools monitor?
They should monitor the signals needed to explain service health, including availability, latency, errors, saturation, logs, traces, dependencies, and user experience. Coverage should follow critical services and journeys rather than stopping at individual devices.
What is the difference between monitoring and observability?
Monitoring checks known signals and conditions so teams can detect expected failure modes. Observability describes how well a team can understand a system’s internal state from its outputs, including investigating failures that were not predicted in advance.
How do you choose an IT monitoring tool?
Start with the service, failure modes, telemetry sources, response owners, and evidence needs. Then evaluate signal quality, coverage, alert control, deployment fit, operating cost, and how well the tool connects detection to action.
How do IT monitoring tools support incident response?
They detect conditions, provide context, and route alerts. A complete incident response process also assigns owners, manages severity and communication, records evidence, controls changes, validates recovery, and captures a post-incident review.
Can Process Street replace an infrastructure monitoring tool?
No. Process Street is not a replacement for infrastructure telemetry or observability. It complements IT monitoring tools by turning alerts into structured response workflows with ownership, required evidence, approvals, automation, and an audit trail.