 On October 3rd 2017, the Financial Times reported that Tesla shares had slumped after the business hit a bottleneck in its production.
Tesla shares fell nearly 2 per cent to $335.91 after the Palo Alto-based company said that it produced just 260 of its Model 3 vehicles in the third quarter, well below the target of more than 1,500 that chief executive Elon Musk had predicted for the month of September alone.
What caused that failure to hit the target?
A bottleneck.
A bottleneck is when one process in a chain of processes cannot perform to the standard of those around it, creating a delay which damages the other processes.
No matter how well Tesla creates batteries or programs its self-driving software, if the factory can’t, for example, install tires fast enough then Tesla can only produce cars at the rate it installs tires.
That poor process brings all of production down to its level. Business output becomes defined by its weakest link.
But it’s not just shop floor industrial processes which fall foul of these problems. Any business or set of operations will be faced with this challenge too. In this article, we’ll look at a couple of approaches you can use to attempt to identify and overcome bottlenecks in your business.
- Flow charts help you visualize current operations
- The Five Whys technique allows you to identify root causes quickly
- Toyota’s three concepts for process implementation focus your improvement
- How Process Street can assist in beating bottlenecks
How a foodbank fed 400 more families in half the time after smashing their bottleneck
Toyota do some excellent community outreach work where they send their process consultants to assist positive social causes in improving their workflows.
In 2013, Toyota sent their team to New York to help optimize operations at the largest foodbank in the country. The Food Bank for New York feeds an estimated 1.5 million people per year and is the largest anti-hunger charity in the US.
However, though donations were healthy and supplies were coming through, the foodbank was having difficulty supplying all the families who needed their help.
This wasn’t the first time Toyota had reached out to an organization with process problems. The New York Times reported:
At a soup kitchen in Harlem, Toyota’s engineers cut down the wait time for dinner to 18 minutes from as long as 90. At a food pantry on Staten Island, they reduced the time people spent filling their bags to 6 minutes from 11.
Toyota quickly set to work analyzing the situation. A bottleneck in a process occurs when input comes in faster than the next step can use it to create output, so Toyota had to track the outputs at different stages of the process to see where the sudden drop off occurred.
The warehouse.
The next steps looked like this:
- The team made a flow chart demonstrating how the process currently exists – how input becomes output.
- A second visual aid was used: a sketch of the warehouse with maps of what movement through the warehouse is currently needed to complete the process.
- Then the consultants analyzed the materials to see where waste may occur: How much food fits in a box? How many boxes fit in a truck?
Through analyzing the process from both a theoretical and physical perspective, plus assessing the resources available, Toyota were able to see the inefficiencies. One individual had to walk back and forth over and over to fill one box. It was the packing which was primarily behind the bottleneck.
Toyota then took measures:
- The flow was restructured to create an assembly line. Rollers were put in place so that the boxes moved around the room rather than the people. This made packing a much more ordered and efficient process.
- New smaller boxes were brought in to eliminate wasted space from the old boxes. The new boxes were then filled to the top, and more of them could fit in one truck. This prepared the distribution team for the coming increase in output and in doing so combatted a potential bottleneck in advance.
According to the New York Times:
[A]t a warehouse in Bushwick, Brooklyn, where volunteers were packing boxes of supplies for victims of Hurricane Sandy, a dose of kaizen cut the time it took to pack one box to 11 seconds from 3 minutes.
Plus, the number of parcels per truck was able to increase from 864 to 1260.
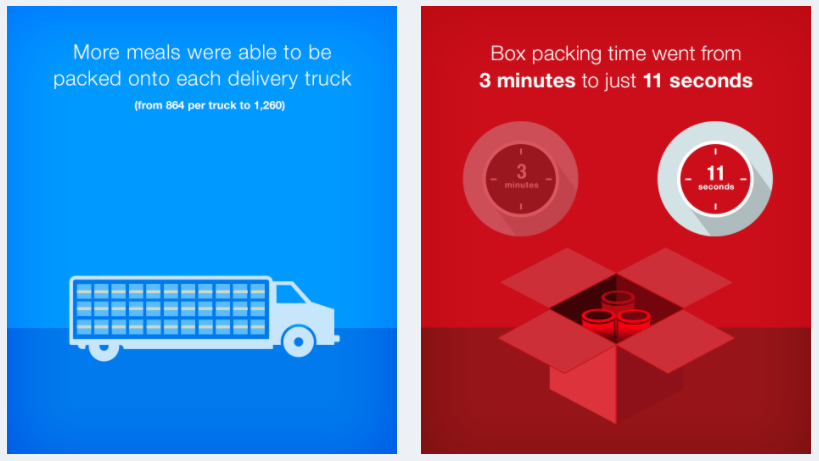 That is what smashing a bottleneck looks like.
What we’ll do is investigate some of the key concepts from this example and look at other methods and approaches to consider when attempting to smash your own bottlenecks.
Flow charts and BPMN help you visualize current operations
Mapping a process visually is an incredibly useful means to assess a process.
One of the key reasons for this is, as we’ve seen with the existence of bottlenecks, each smaller process in a broad workflow is impacted by the other processes around it.
Being able to see all of these steps within one view gives the analyst the ability to take a holistic approach to the overall process.
The grandfather of process mapping was Frank Gilbreth who, in 1921, presented a paper to the American Society of Mechanical Engineers entitled “Process Charts: First Steps in Finding the One Best Way to Do Work”. In the paper he notes:
Every detail of a process is more or less affected by every other detail; therefore the entire process must be presented in such form that it can be visualized all at once before any changes are made in any of its subdivisions
This set the tide in place to begin visual mapping of processes and led to the kind of business process modelling we see today.
A flow chart can be as simple you want to make it.
It can be a quick sketching on paper of the different constituent parts of a process with arrows showing the flow of energy and action through the process. This is something you might be able to do in a couple of minutes – and something you should be doing given how easy and quick it is!
However, we’re going to try to give you a little more value to take away, because anyone can draw two squares and an arrow. One of the current most highly evolved forms of flow charts or process mapping is Business Process Model & Notation, which you can read about in depth here in our BPMN Tutorial.
BPMN is a technique for approaching flow charts which lets you identify actions, states, tasks, events, starts, finishes, and flows. Plus a whole range of other detailed elements. Once you know how it works, it becomes a really useful way of representing business operations.
Check out the image below for a really simple portrayal of BPMN in action.

According to Trisotech, BPMN is popular because:
It provides businesses, with the capability of understanding their internal business procedures in a graphical notation, and gives organizations the ability to communicate these procedures, in a standard manner
I’ll give you a rough taster of how BMPN operates, but I recommend checking out our tutorial for a more in depth guide with extra graphics and video resources.
BPMN foundations are built on a basis of pools and lanes. A pool is broadly an organization or the overall scope of a process. Within each pool lies a series of lanes. These lanes either represent different teams within the organization or process, or they represent different subprocesses – depending on how your organization is structured and how you wish to convey that.
You can see the overview of how this might be communicated in the image below:
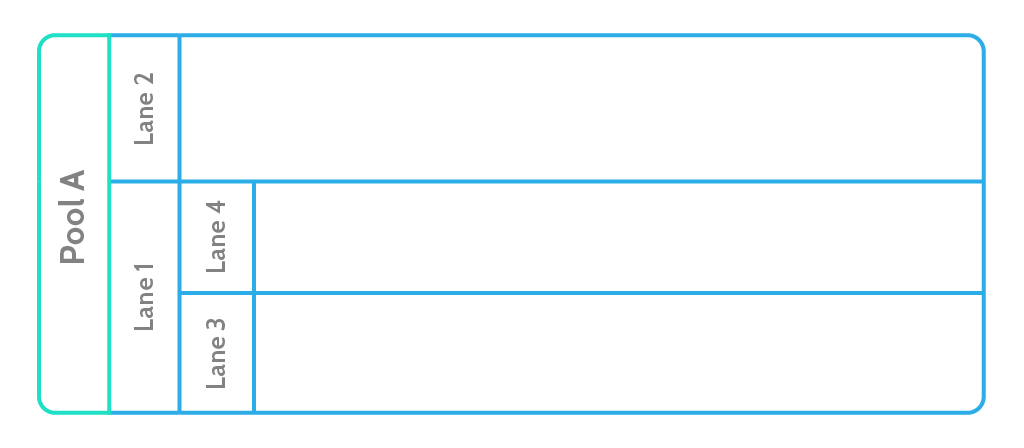
From this basis, different pools can impact on other pools; a factory deals with the production process in one pool, which is then passed on to the delivery team whose process is documented in a second pool.
This use of boxes designates departments as pools and then smaller boxes as lanes for processes, with smaller boxes inside them representing individual tasks or further subprocesses.
It might sound confusing, but it means that the scope of each group of people is defined clearly within the visuals.
Further to that, the nature of the notation is standardized so that different shapes or lines have specific meanings. There are countless examples as you get into the detail of BPMN, but you can find a quick example in this image:
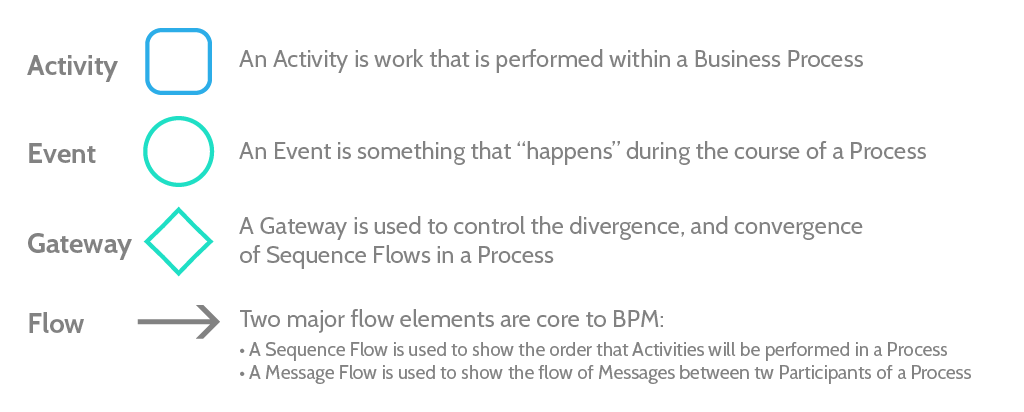
If you want to start creating high level effective flow charts for your business, it is really worth taking a short bit of time to familiarize yourself with the notation so that you can employ these techniques for best results.
You can also checkout this free Process Street template here to help you in creating a process map from scratch:
The Five Whys technique allows you to identify root causes quickly
After the slight technical focus of BPMN, let’s move to something more simple and obvious.
The Five Whys technique is not a complex approach to solving problems. It’s simply a short and effective way to keep yourself grounded in uncovering problems.
It’s like the rubber duck approach to finding bugs in code. When a programmer is stuck and can’t understand why their code isn’t working as it should, the programmer turns to the little rubber ducky on their desk and tries to teach it about how the code is structured and why they’ve made the decisions they’ve made.
An astonishing amount of the time, explaining the code to the rubber duck shines a light on where the problem is.
Rubber ducks are the MIT grads of the bathtub ensemble.
 The point of that approach is that it reminds you to ask yourself the right questions and to move through your work in a logical progression.
Identifying problems is often simply about asking the right questions.
This whole methodology is based on the assumption that by asking those questions, you can boil down to the root of the problem and understand what exactly is going wrong. It’s the eight year old in you being called upon to tackle operational problems.
First, ask why something is not working, then keep asking why until you’ve reached deep into your approach.
Wikipedia give one of the clearest examples:
- The vehicle will not start. (the problem)
- Why? – The battery is dead. (First why)
- Why? – The alternator is not functioning. (Second why)
- Why? – The alternator belt has broken. (Third why)
- Why? – The alternator belt was well beyond its useful service life and not replaced. (Fourth why)
- Why? – The vehicle was not maintained according to the recommended service schedule. (Fifth why, a root cause)
In this example, you now not only understand why the car wouldn’t start, but you also know how you came to be in that position where a broken car is sitting in your drive.
The Five Whys approach is useful because it often highlights first a technical reason for a problem, and then highlights a human reason for that technical reason; allowing you to fix your immediate concerns and put in place processes to avoid making that mistake again.
This video from Harvard Business Review on the Five Whys provides a nice explanation of how that works. This technique is used by companies like Buffer and Zappos in their day to day operations, which we described in our article on their organizational structures.
The Five Whys is all about finding the underlying process problem. And it’s a super easy way of doing it.
Toyota’s concepts for process improvement
In a previous article, I took a look at Toyota’s outreach efforts where they attempt to use their process superpowers for good.
We looked at how they engineered a fall in infection rates at a children’s hospital by 75%, how they increased home rebuilding speeds for those displaced by Hurricane Katrina by 48%, and how they managed to improve a food bank’s processes to the point where an extra 400 hungry families were able to be given food parcels. In two of these examples, Toyota analyzed operations to find where the bottleneck occurred and then set about trying to understand how to smash that bottleneck.
Their techniques are effective, and in each scenario they utilized a slightly different concept.
Three of the key concepts as outlined in our process implementation article are:
- Genchi genbutu – to “go and see”, to embed yourself in the system and observe,
- Kaizen – to employ ideas of continual improvement, making small iterative changes,
- Muda – to identify waste, and to recognize that what constitutes waste is contingent on your situation
Genchi genbutu
Genchi genbutu is about making sure you are present where the processes are occurring so that you can see the bigger picture and operate holistically. It literally translates as “go and see” and the idea is that you should embed yourself in the system and observe on a day to day how things operate.
If you have a problem with a bottleneck in one of your factories, you should analyze the data and learn as much as possible but then you should go to visit the factory and see for yourself how operations occur on the shop floor. This embedded approach to process improvement allows you to spot problems which don’t show up on spreadsheets.
Kaizen
Kaizen is another simple concept and one which we at Process Street are big advocates for. This philosophy behind kaizen is that there should always be a focus on continual improvement. This improvement is more effective when it arises from small iterative changes rather than grand sweeping overhauls.
There are exceptions to this. In cases where the normalization of deviance has seeped into a company’s structures, an overhaul is probably needed. But when looking to overcome a bottleneck, we can look at where small changes can be made within a process to add little bumps to efficiency. With each of these small iterative improvements, the overall process grows stronger and more effective; helping you smooth out your bottleneck gradually and with stability.
Muda
Muda literally translates as waste, but conceptually represents an approach to understanding waste. Part of this is understanding what activities are creating value and which are not. Depending on the situation, you should then look to maximize the effectiveness of the highest value activities while reducing activities with lowest value.
When Toyota went into a series of eye hospitals in the US to try to improve their performance, they focused on improving the turnover of patients by streamlining administrative activities and helping individual doctors be more standard with their approaches.
These small changes massively reduced the overall time spent by patients in the waiting areas and increased overall high value patient time spent with doctors. It broke down the bottleneck.
Our 3 key tools to smash your business bottlenecks
Process Street gives you the tools to improve your workflows
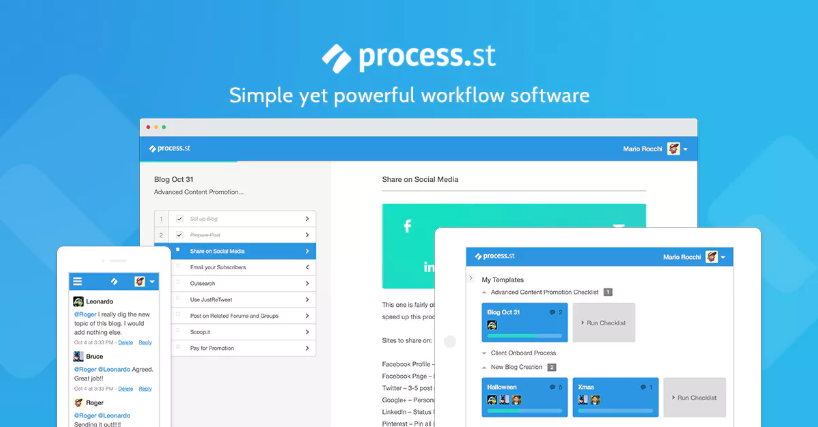 Process Street‘s sole purpose is to improve your business processes.
It’s what we do.
As such, we want to make sure we can help you beat process problems like bottlenecks when they occur.
There are three key elements to Process Street which I’d like to pull out and present in relation to bottlenecks, though they don’t cover all of Process Street’s functionalities or use cases:
- Standardized processes improve performance
- Processes can be collectively edited to make use of your team’s expertise
- Automations can help reduce waste and maximize value creation
Standardizing your processes means that every person in your team is using the best possible process you have available at that time. From a manager’s perspective, you can see the overviews of the checklists being run and how the staff are interacting with that checklist. This means that you can see how long it took from start to finish, and you can gain feedback on how the process is performing.
Moreover, once you have standardized processes, you can begin to analyze and improve the processes. If people aren’t following a set process then your attempts to fix bottlenecks will ultimately be useless.
To fight business process failures you need solid business process foundations.
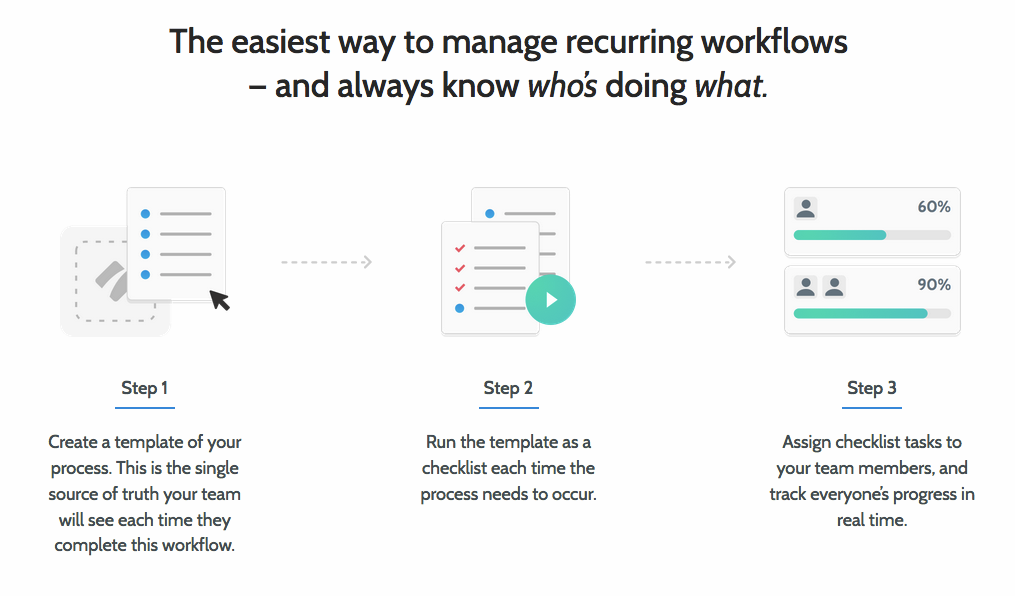 You may also consider making use of the editing functionalities of Process Street. If you have a high skilled team who are capable of analyzing and improving their own processes, then give them editing permissions for process templates.
This helps allow for both collaborative and iterative improvements of your business processes without you needing to micromanage every step of the way. This kind of trusting approach can help tackle bottlenecks before they arise simply through having effective systems in place.
Finally, in the event that you do need to tackle a bottleneck, one effective means for reducing waste within business processes is to automate tasks where possible. There are many tasks such as data entry which computers can do much faster than humans -almost instantaneously. If your employee creates value when they do x task, then you want to maximize the time they spend doing x rather than data entry or other responsibilities.
Process Street integrates with Zapier, allowing you to connect it to over 800 other web and mobile apps to automate simple yet time consuming parts of your workflow.
Lucidchart will bring your flows to life
 To make flow charts and utilize your knowledge of BPMN, it helps to have a software which can support you.
Lucidchart provides a powerful diagram maker which you can use to easily convey complex information simply to your team.
You can get started easily and utilize the software for mind mapping or simple flows before jumping in the deep end and attempting to map your entire business. As it is an online tool, your work is stored in the cloud to make it easier to share and collaborate.
Lucidchart integrates with G Suite and other tools to better fit into your workflow.
If you’re going to make flow charts and diagrams, give them a try!
Zapier’s automations can help you minimize waste
 Automation is all the rage nowadays.
And with good reason.
Being able to automate elements of your process – or even whole tasks – is a great way to attain efficiency in your business. So much of what we do every day can be automated that we’re lagging behind if we’re not doing it.
According to the report Four Fundamentals of Workplace Automation by McKinsey, 15% of a marketing executive’s time can already be automated by readily available technologies. When was this published? Last month? Nope. Two years ago.
Automation is moving quickly and tools like Zapier are the easiest way to start integrating its potential into your business.
We probably have to correct a number of old articles of ours as every time we say Zapier connects with “over 500 apps” or “over 750 apps” they suddenly announce a whole barrel more. As of November 2017, Zapier connect with over 800 apps. That’s a lot of apps.
This potential allows you to automate time consuming tasks like data entry and a host of more complex duties.
Browse through their available Zaps (individual integrations between apps) and see the potential for what you could get done.
You can also read our ebook on the matter: Ultimate Guide to Business Process Automation with Zapier
Systemize your business today to smash your business bottlenecks!
Let’s cover it one more time.
You can use flow charts and process mapping to gain a full visual understanding of how your business processes are operating. With the use of advanced techniques like business process model & notation you are able to turn complex flows into easily visualizable overviews.
To dig down even deeper into these processes to uncover the roots of problems you can employ techniques like the Five Whys, revealing not just the technical causes behind problems but the process failures which underlie them also.
Using Toyota’s concepts for process improvement, you can appreciate the processes in their embedded form, work to to better them iteratively in a continuous manner, and use the minimization of waste to guide your priorities.
And Process Street can help you navigate the journey.
Have you experienced bottlenecks in your business processes? How did you deal with them? Let us know in the comments below!


 Workflows
 Projects
 Data Sets
 Forms
Forms Pages
Pages Automations
 Analytics
 Apps
Apps Integrations
 Property management
 Human resources
 Customer management
 Information technology


Adam Henshall
I manage the content for Process Street and dabble in other projects inc language exchange app Idyoma on the side. Living in Sevilla in the south of Spain, my current hobby is learning Spanish! @adam_h_h on Twitter. Subscribe to my email newsletter here on Substack: Trust The Process. Or come join the conversation on Reddit at r/ProcessManagement.