

Turn every policy into automated workflows with built-in enforcement and audit-ready proof.



Process Analytics
Process analytics is the practice of measuring how work actually moves through a business, explaining why performance changes, and turning that evidence into better decisions. It connects process data, operational context, and improvement action so teams can see where flow slows, quality breaks, controls drift, or outcomes miss the target.
A useful process analytics program goes beyond dashboards. It defines the decisions a team needs to make, the events and measures that support those decisions, the owners who respond, and the proof that an intervention worked. The result is a closed loop from execution to insight to action.
This guide explains the data, metrics, methods, implementation steps, and operating model behind process analytics. It also shows how to connect analysis to accountable workflows instead of leaving findings in reports.
In this article, we are going to cover:
- What is process analytics?
- Why process analytics matters
- The data behind process analytics
- Process analytics metrics that matter
- Process analytics methods
- How to implement process analytics
- Process analytics in Process Street
- How to build process analytics maturity
- FAQs
What is process analytics?
Process analytics examines the behavior and performance of repeatable work. It asks what path each case followed, how long the work took, where it waited, which steps repeated, whether required controls were followed, and what outcome the process produced.
The unit of analysis is a process instance
A process instance is one run of a repeatable process, such as one customer onboarding, one purchase request, one incident review, or one policy approval. Each instance creates events. Those events may include a task starting, a form being submitted, an approval being granted, a status changing, or an automated action completing.
Process analytics connects those events using a case identifier, activity name, timestamp, owner, status, and relevant business attributes. That structure lets an analyst compare hundreds of process instances without losing the sequence that makes the work understandable.
Process analytics is broader than process mining
Google Cloud process mining guide defines process mining as a technique that analyzes event logs to discover, monitor, and improve business processes. IBM process mining overview describes it as applying specialized algorithms to event logs to reveal how workflows unfold. process mining is therefore an important method inside process analytics, but it is not the entire discipline.
Process analytics can also use workflow reports, manually captured observations, control results, customer outcomes, staffing data, survey feedback, and financial or quality measures. It combines quantitative analysis with the operational knowledge needed to interpret what the data means.
Process analytics differs from business intelligence
Traditional business intelligence often aggregates results by department, product, customer, or period. Process analytics preserves the path of work. Instead of only showing that a backlog increased, it shows which handoff created the wait, which cases looped backward, and whether the delay affected quality or compliance.
Why process analytics matters
Processes hide their problems inside averages. A monthly completion rate can look healthy while one region, customer segment, approval route, or exception type repeatedly fails. Process analytics exposes that variation and gives leaders a more precise place to intervene.
It replaces assumptions with evidence
Documented procedures describe how work should happen. Execution data shows how it did happen. Comparing the two helps teams separate an isolated exception from a structural design problem. That evidence also improves conversations between frontline operators, process owners, analysts, and leadership.
Better process transparency reduces the need to reconstruct work from email, spreadsheets, and memory. Teams can see the real flow, then use process documentation to align the written standard with what good execution requires.
It finds constraints before they become outcomes
A constraint is the step, resource, rule, or dependency that limits the performance of the whole process. It may be an overloaded approver, missing input, unclear decision rule, brittle integration, or batch schedule. Process analytics helps locate the constraint and quantify its effect on cycle time, rework, service, risk, or cost.
It creates a measurable improvement loop
Analytics gives a continuous improvement process objective feedback. A team can establish a baseline, test a change, compare the result, and decide whether to standardize, revise, or reverse the intervention. ASQ PDCA cycle describes PDCA as a repeated four-step model for carrying out change, which maps naturally to this evidence-driven loop.
The discipline matters because improvement without measurement can simply move the problem. Shortening one task may increase rework downstream. Automating an approval may speed routine cases while weakening exception handling. The whole process needs to be measured as a system.
The data behind process analytics
Process analytics depends on data that can reconstruct execution with enough context to explain performance. The most important data is not always the largest data set. It is the data that connects a process case, its sequence of events, and its outcome.
Core event data
- Case identifier: the unique ID that ties every event to one process instance.
- Activity: the task, decision, status change, or automation that occurred.
- Timestamp: when the event started, completed, or changed state.
- Actor or system: the person, team, role, application, or agent responsible.
- Outcome attributes: quality, risk, customer, financial, or compliance results connected to the case.
Context data
Context explains why two cases with the same path may perform differently. Useful dimensions include case type, complexity, priority, location, customer segment, product, risk tier, channel, team, and exception reason. Good context supports segmentation without turning the data model into an ungoverned collection of fields.
Process models and operating standards
A process model gives the analysis a reference point. OMG BPMN specification publishes BPMN as a standard notation for business processes. Teams do not need a formal BPMN model for every analysis, but they do need an agreed view of the intended flow, control points, and outcomes.
A strong process system keeps that intended process connected to live execution. Analytics can then compare the expected path with observed work, identify deviations, and distinguish an approved exception from uncontrolled drift.
Data quality requirements
Missing timestamps, inconsistent case IDs, duplicate events, vague statuses, and changing field definitions can distort conclusions. Before trusting a result, teams should document the source, owner, refresh rhythm, transformation logic, known gaps, and valid use of every critical measure.
Process analytics metrics that matter
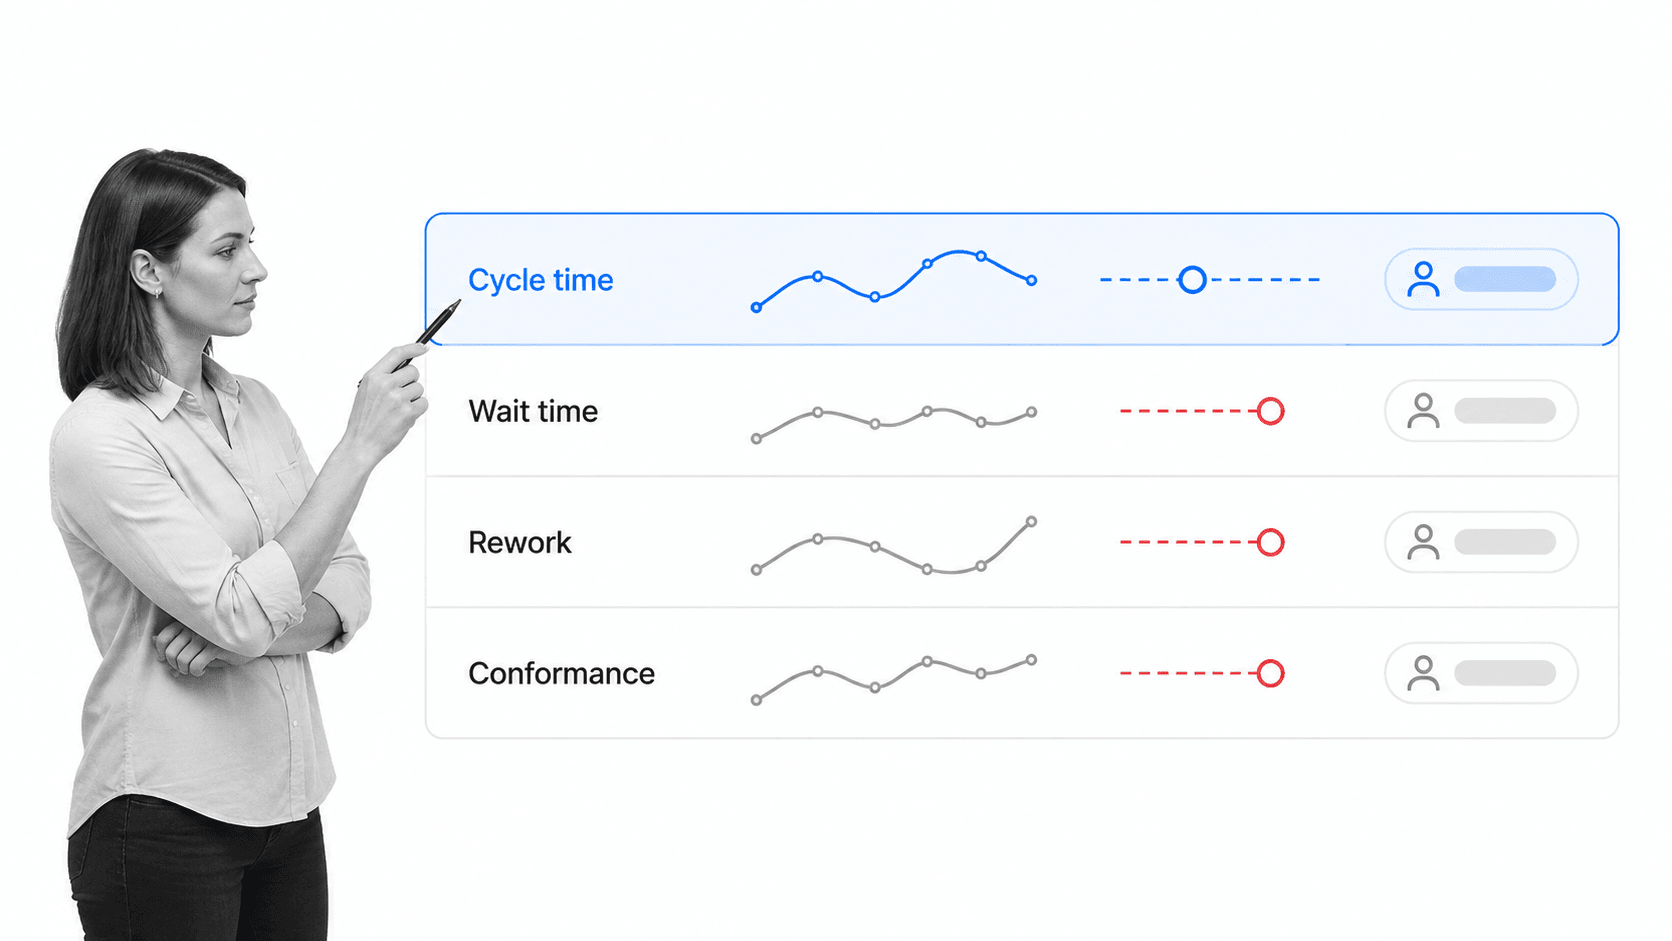
The best process analytics scorecard balances flow, quality, conformance, and outcome. Tracking only speed encourages shortcuts. Tracking only compliance can hide unnecessary friction. Tracking only outcomes makes it difficult to locate the operational cause.
Flow metrics
Cycle time measures the elapsed time from a defined start to a defined finish. Touch time measures active work. Wait time captures the gap between activities. Throughput counts completed cases in a period. Together, these measures show whether work moves, waits, or accumulates.
Quality and rework metrics
First-pass yield, defect rate, reopening rate, repeat submission, and correction loops reveal whether work finishes correctly. Rework is especially important because it can make a fast process look productive while consuming hidden capacity.
Conformance and control metrics
Conformance asks whether the process followed required steps, decisions, approvals, segregation rules, and evidence requirements. Useful measures include skipped-step frequency, late approval, policy exception, missing evidence, unauthorized path, and unresolved control failure.
Outcome metrics
Outcome metrics connect process performance to what the business or customer actually needs. Examples include resolution quality, onboarding completion, service level, customer effort, claim accuracy, audit readiness, or successful remediation. The outcome should be close enough to the process that the team can plausibly influence it.
Segmented measures
Every important metric should be segmentable by the factors that may explain variation. A cycle-time average becomes useful when it can be split by case type, risk tier, owner, route, exception reason, or source. Segmentation turns a symptom into a testable hypothesis.
Process analytics methods
Process analytics methods range from simple descriptive reporting to sequence analysis and predictive monitoring. The right method depends on the decision, data quality, process maturity, and cost of acting on a false signal.
Descriptive analysis
Descriptive analysis establishes what happened. It summarizes volume, cycle time, wait time, rework, conformance, outcome, and variation. This is the foundation because teams cannot improve a process they cannot measure consistently.
Diagnostic analysis
Diagnostic analysis tests why performance changed. Analysts segment cases, compare paths, examine queues, review exception reasons, and trace dependencies. The goal is not merely correlation. It is a credible operational explanation that can guide an intervention.
Conformance checking
Conformance checking compares actual execution with an intended model or rule set. It identifies skipped steps, alternate routes, premature closure, missing approvals, and unexpected loops. The method is valuable when safety, quality, compliance, or consistency matters.
Predictive monitoring
Predictive monitoring estimates what may happen to an active case, such as a likely delay, escalation, defect, or missed outcome. Use it only when the signal arrives early enough to change the result and the team has a defined response workflow.
Prescriptive action
Prescriptive analytics recommends an action based on the signal and context. It should be introduced after teams trust the data, understand the failure modes, and have clear authority rules. Recommendations without ownership or review simply create another queue.
Process Analytics: Concepts and Techniques covers process data querying, process models, execution data, and scalable analysis methods, showing why the discipline reaches beyond a single dashboard or technique.
How to implement process analytics
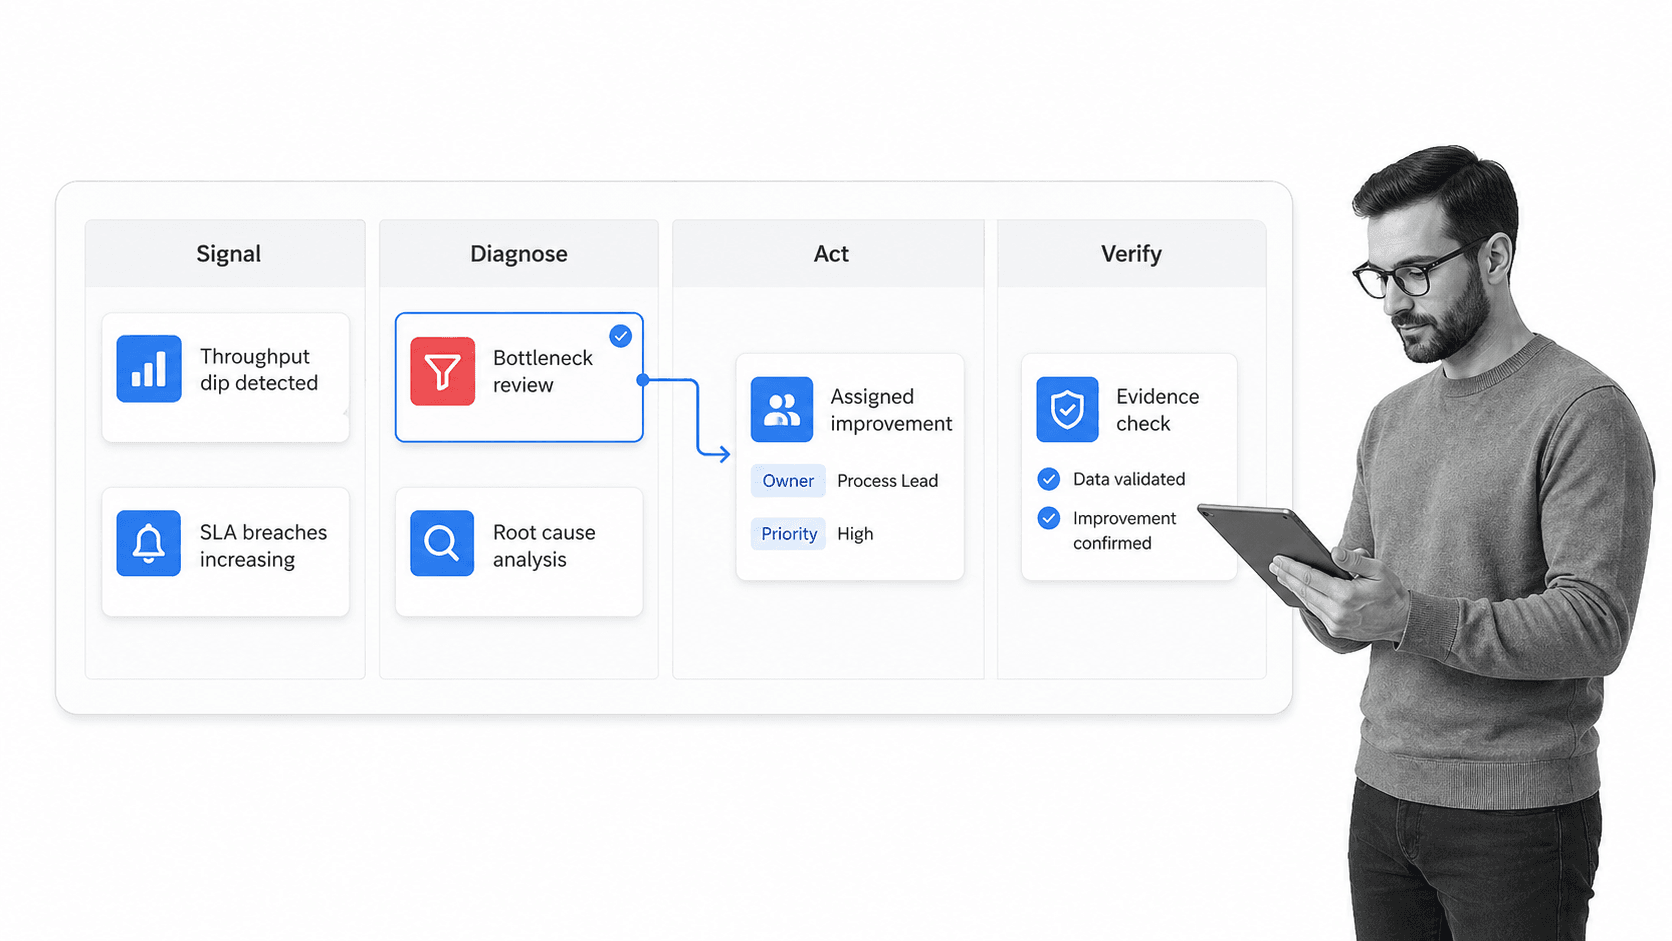
A successful implementation begins with a decision and ends with verified action. Starting with a large data lake or a catalog of dashboards often produces impressive analysis that no operating team owns.
Step 1: Choose one process and decision
Pick a process with meaningful volume, a visible problem, an accountable owner, and a decision the analysis can improve. Define the start, finish, customer, outcome, and scope. A narrow, complete process is better than an enterprise-wide map that nobody can act on.
Step 2: Define the process question
Good questions are specific: Which approval route creates the longest wait? Which exception type causes repeat work? Where do high-risk cases bypass review? Which early signal predicts a missed service level? The question determines the data and method.
Step 3: Build a trustworthy event model
Map the case ID, activities, timestamps, actors, attributes, and outcomes. Reconcile duplicate and missing events. Confirm definitions with the people who run the process. Keep a data dictionary so the same metric means the same thing across reports.
Step 4: Establish a baseline
Measure current flow, quality, conformance, and outcome across a representative period. Segment the baseline to expose variation. Document known data limitations so a future comparison does not create false precision.
Step 5: Connect the signal to work
Every actionable finding needs an owner, response rule, evidence requirement, and review point. process monitoring identifies when performance moves outside the expected range, while workflow monitoring keeps active work visible. The response should live in the same operating rhythm as the process.
Step 6: Test and verify the intervention
Change one meaningful constraint, then compare the result with the baseline. Use workflow optimization to improve flow without weakening controls or quality. If the change works, update the standard. If it does not, preserve the learning and test the next hypothesis.
Process analytics in Process Street
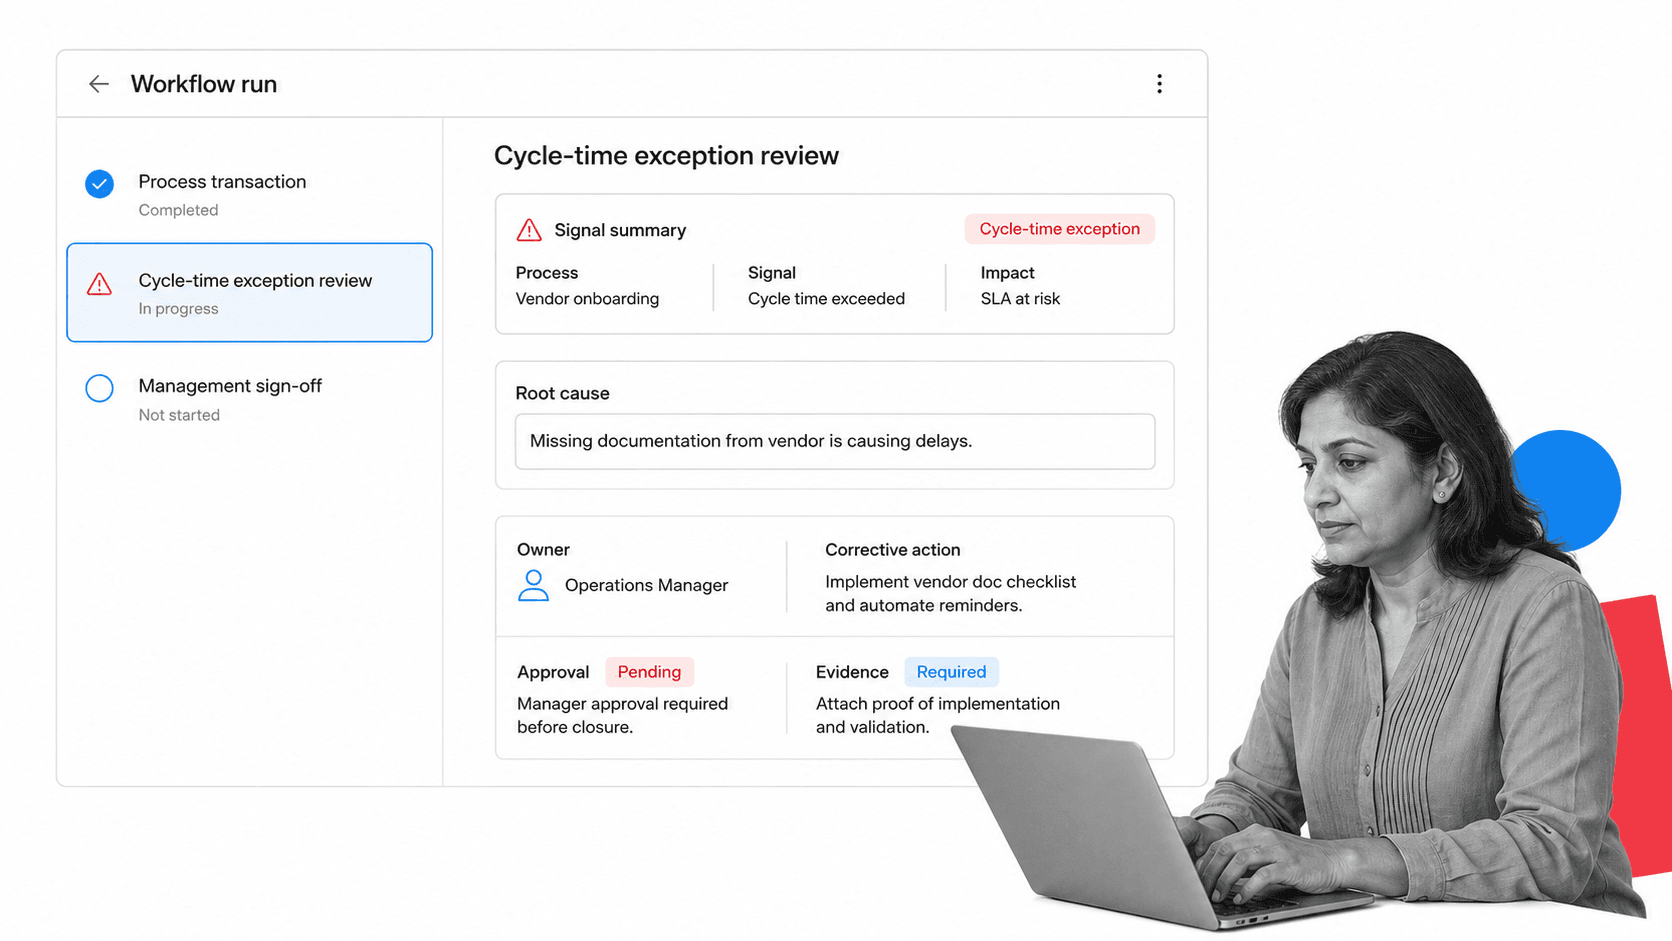
Process analytics in Process Street connects measurement to execution. Process Street is a Compliance Operations Platform that brings governed documentation, workflow execution, and built-in AI oversight into one operating system.
Capture process events as work happens
Workflow runs create structured records of tasks, owners, form fields, decisions, approvals, evidence, and status. That data gives teams a process-aware foundation for understanding throughput, delay, rework, exceptions, and conformance.
Turn exceptions into assigned action
When a process measure crosses a threshold or a control fails, a workflow can assign review, collect the root cause, require corrective action, route approval, and preserve evidence. The insight does not need to wait for a meeting or disappear inside a report.
Keep the standard and execution connected
A process builder lets teams design the intended process, while the live workflow records how each case runs. That connection supports stronger analysis because the documented standard, execution path, and improvement action stay close together.
Connect process data to analysis tools
Teams can use BI integrations to move workflow data into reporting and analytics environments. The important design choice is to keep the action loop connected: analysis can happen in a specialized surface, but owners, approvals, evidence, and follow-up should return to accountable work.
This closes the gap between workflow management system and analysis. The management system does not merely display performance. It gives the team a controlled way to respond and prove what changed.
How to build process analytics maturity
Process analytics maturity is the ability to make reliable operational decisions from process evidence, then improve the process without losing control. Maturity comes from stronger questions, definitions, ownership, and action loops, not from buying the most advanced tool.
Reporting stage
The team can report basic volume, completion, cycle time, and backlog, but definitions may vary and action is informal. The priority is to standardize measures, name owners, and remove obvious data gaps.
Diagnostic analysis stage
The team can segment measures, compare paths, identify constraints, and explain major variation. Analysts work directly with process owners, and improvement hypotheses are tied to evidence.
Governed action stage
Signals trigger defined workflows with owners, due states, evidence, and review. The team can show which finding led to which intervention and whether the intervention changed the result.
Predictive and adaptive operations stage
Reliable early signals help the team intervene before an outcome fails. Models and recommendations are reviewed, monitored, and bounded by clear authority. The process adapts while policy, evidence, and accountability remain intact.
The path between levels should be deliberate. Start with a process whose data and ownership are strong, use the available process tools, and expand only after the measurement-to-action loop works. That is how process improvement becomes a repeatable operating capability instead of a one-time analysis project.
FAQs
What is process analytics?
Process analytics is the practice of measuring how repeatable work flows, explaining why performance changes, and using that evidence to improve execution. It combines event data, process context, metrics, analysis methods, and accountable action.
What is the difference between process analytics and process mining?
Process mining uses event logs and specialized algorithms to discover, monitor, and compare process paths. Process analytics is broader: it can include process mining, workflow reporting, control results, observations, outcome measures, diagnostic analysis, and the operating system that turns findings into action.
Which process analytics metrics should a team track?
Track a balanced set of flow, quality, conformance, and outcome metrics. Common measures include cycle time, wait time, throughput, rework, skipped steps, missing approvals, exception rates, and a business or customer outcome that the process can influence.
What data is needed for process analytics?
At minimum, use a case identifier, activity name, timestamp, actor or system, status, and outcome attributes. Add context such as case type, risk tier, location, priority, exception reason, or customer segment when those dimensions help explain variation.
How do you implement process analytics?
Start with one process and one decision. Define the question, build a trustworthy event model, establish a baseline, analyze the constraint, connect the finding to assigned work, and verify whether the intervention improved flow, quality, conformance, or outcomes.
How does Process Street support process analytics?
Process Street captures structured workflow activity and turns process findings into governed action. Teams can assign owners, collect root causes, require evidence, route approvals, preserve audit history, and connect workflow data to reporting and analytics tools.