


Turn every policy into automated workflows with built-in enforcement and audit-ready proof.



Software Workflow Diagram

A software workflow diagram is a visual map of how software work moves from a trigger to an outcome. It shows the stages, tasks, decisions, owners, data, exceptions, review gates, and feedback loops that shape a change before and after it reaches production.
The diagram is useful because software work is rarely a straight line. Requirements change. Reviews send work back. Tests fail. Security findings create new paths. Releases pause for approval. A clear diagram makes those routes visible before the team turns them into tickets, code, automations, or operating controls.
This guide explains the symbols and structures that matter, the diagram types that fit different questions, a practical creation method, a worked example, and the steps required to turn a picture into an executable workflow.
In this article, you are going to cover:
- What is a software workflow diagram?
- The anatomy of a useful software workflow diagram
- Software workflow diagram types and notation
- How to create a software workflow diagram step by step
- Software workflow diagram example
- How to review and maintain the diagram
- Turn a software workflow diagram into an executable workflow
- FAQs
What is a software workflow diagram?
A software workflow diagram represents the operating path behind software delivery or software-enabled work. It may describe how a feature moves from request to release, how a defect moves from report to resolution, how an access request is approved, or how data passes between services. The broader software development workflow is the repeatable system. The diagram is the visual model used to understand and improve that system.
What the diagram must answer
A useful diagram lets a reader answer five questions without a meeting: What starts the work? What happens next? Who owns each step? Which conditions change the route? What proves the workflow reached a valid outcome? If the drawing cannot answer those questions, it is probably decoration rather than an operating model.
Where the diagram fits
Teams often create the diagram during discovery, process design, architecture review, onboarding, control design, or automation planning. It complements workflow mapping by giving the agreed route a compact visual form. It also supports workflow documentation by showing relationships that are difficult to scan in prose.
A diagram is not the workflow itself
A picture cannot assign work, enforce a due date, require evidence, route an exception, pause for approval, or create an audit history. It explains the logic. An executable workflow applies that logic to real cases. Treat the diagram as a design artifact and shared language, then connect it to the system that runs the work.
The anatomy of a useful software workflow diagram
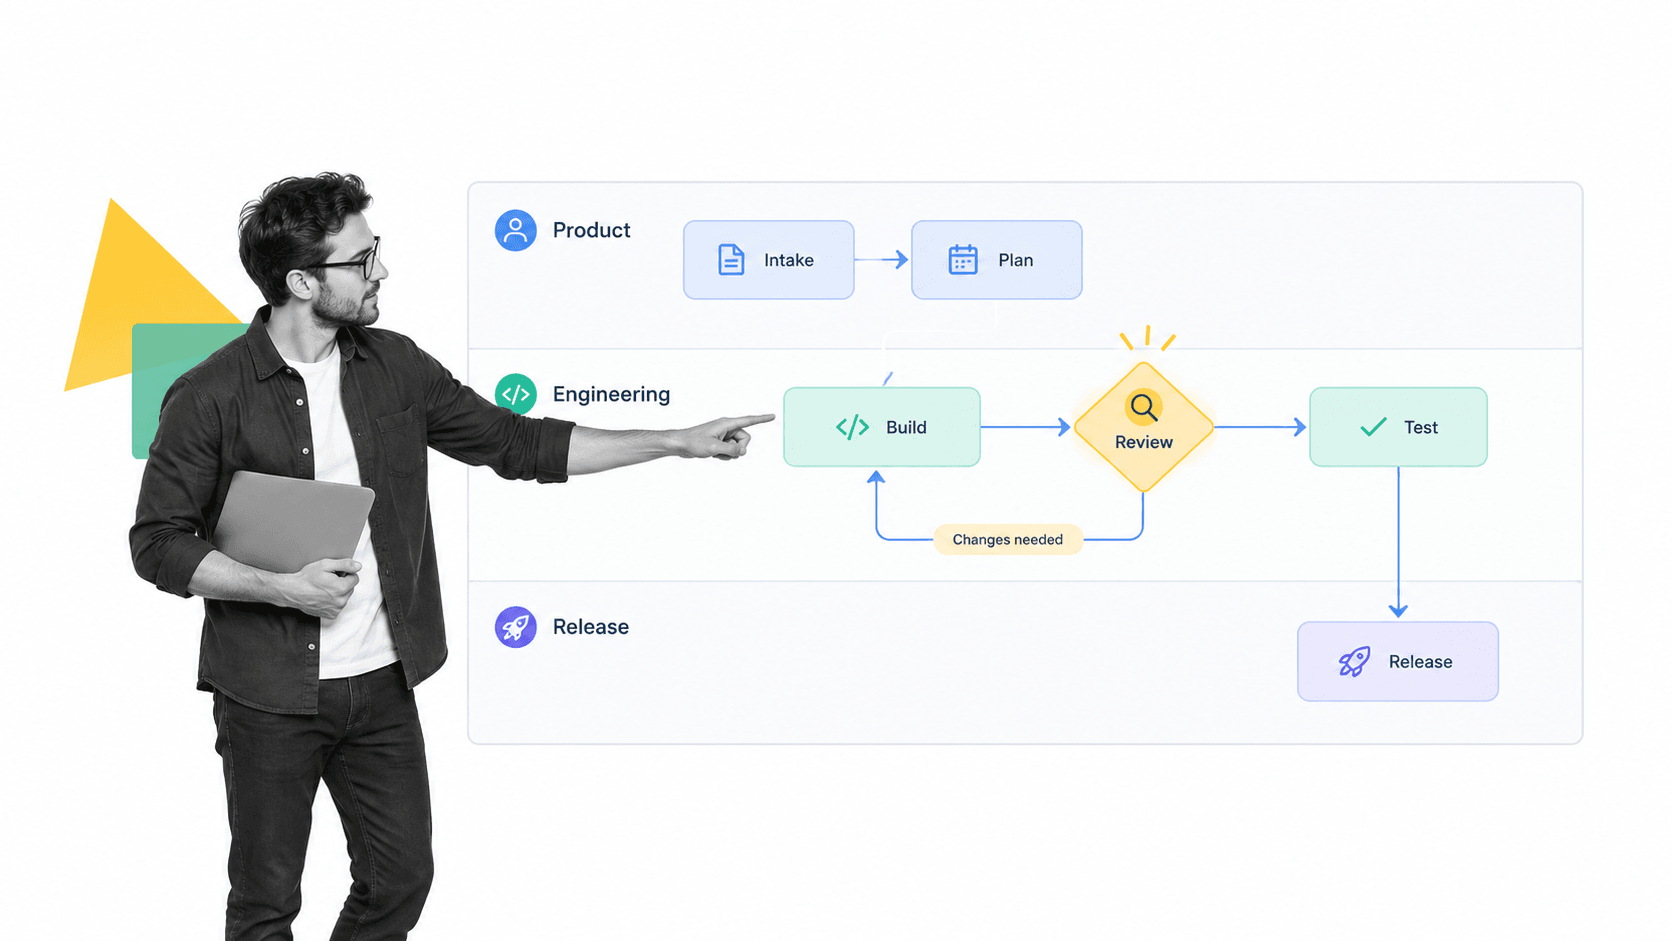
The best software diagrams are selective. They show enough structure to support a decision, but not every technical detail the organization knows. Start with the reader and the question. A product leader may need stages and ownership. An engineer may need service boundaries and data movement. An auditor may need controls, approvals, and evidence.
Trigger and outcome
Mark the event that starts the workflow and the result that ends it. A feature workflow might begin with an approved request and end with a monitored release. A defect workflow might begin with a confirmed report and end with a verified fix or an explicit decision not to change the product. Clear boundaries prevent the diagram from absorbing unrelated work.
Activities and stages
Use activities for units of work and stages for meaningful groups such as Intake, Design, Build, Review, Test, Release, and Monitor. Keep activity labels verb-led. Review architecture is clearer than Architecture Review Box 2. The reader should understand what changes at each step.
Decisions and branch conditions
Every branch needs a question and labeled outcomes. Is the change high risk? Did the test pass? Is security review required? An unlabeled diamond hides the exact policy the workflow is supposed to express. Show the return path as carefully as the forward path, because recovery routes determine how work behaves under pressure.
Owners and swimlanes
Swimlanes divide the diagram by role, team, system, or service. They expose handoffs and make responsibility visible. The swimlane diagram guide explains how lanes clarify ownership without duplicating the sequence in separate documents. Use as few lanes as the decision requires.
Data, evidence, and systems
Show the important information entering or leaving a step, especially when it controls routing or proves completion. Requirements, risk scores, test results, approval decisions, release notes, and monitoring signals may belong in the diagram. Avoid listing every field. Name the data that changes behavior or creates accountability.
Controls and feedback loops
Software workflows often need review gates, required evidence, separation of duties, and escalation. Show where work can stop and who can release it. Also show the feedback path from test failures, production incidents, customer signals, or monitoring back into planning. A diagram that only moves forward hides how software actually improves.
Software workflow diagram types and notation
Choose the diagram type based on the question, not the tool available. A simple flowchart may be perfect for a small team. A formal notation may help when several systems, departments, or automation engines must interpret the same model.
Basic flowchart
A basic flowchart uses start and end shapes, action rectangles, decision diamonds, data shapes, and directional connectors. IBM defines a workflow diagram as a visual representation of a process that uses symbols and notation to show how work is done. This format is easy to read and works well for feature, bug, release, and support workflows.
Swimlane diagram
Use a swimlane diagram when ownership and handoffs are central. Each lane represents a role, team, system, or service. The sequence crosses lanes as responsibility changes. This exposes queues, duplicated reviews, and unclear ownership that a single-lane flow can hide.
BPMN diagram
Business Process Model and Notation is useful when events, messages, gateways, participants, and executable process semantics matter. The Object Management Group BPMN specification is the authoritative reference. Use BPMN when the audience understands the notation or when the model will inform automation. Do not use formal symbols merely to make a simple workflow look sophisticated.
UML activity diagram
A UML activity diagram fits software behavior, concurrent actions, decisions, object flows, and system interactions. The Object Management Group UML specification defines the language. Activity diagrams are useful when the workflow is tied closely to system design, but they should still tell an operational story that non-specialists can follow.
Data flow and architecture views
Use a data flow diagram when the main question is how information enters, changes, moves, and leaves a system. Use an architecture view when the main question is which components or services interact. The C4 model separates software architecture into system, container, component, and code views so teams can choose an appropriate level. These views can sit beside the workflow diagram, but combining all three into one canvas usually produces clutter.
Which notation should you choose?
Choose the least complex notation that answers the question accurately. Use a basic flowchart for shared understanding, swimlanes for ownership, BPMN for formal process semantics, UML activities for system behavior, and data flow diagrams for information movement. Add a legend whenever a symbol could be misunderstood.
How to create a software workflow diagram step by step
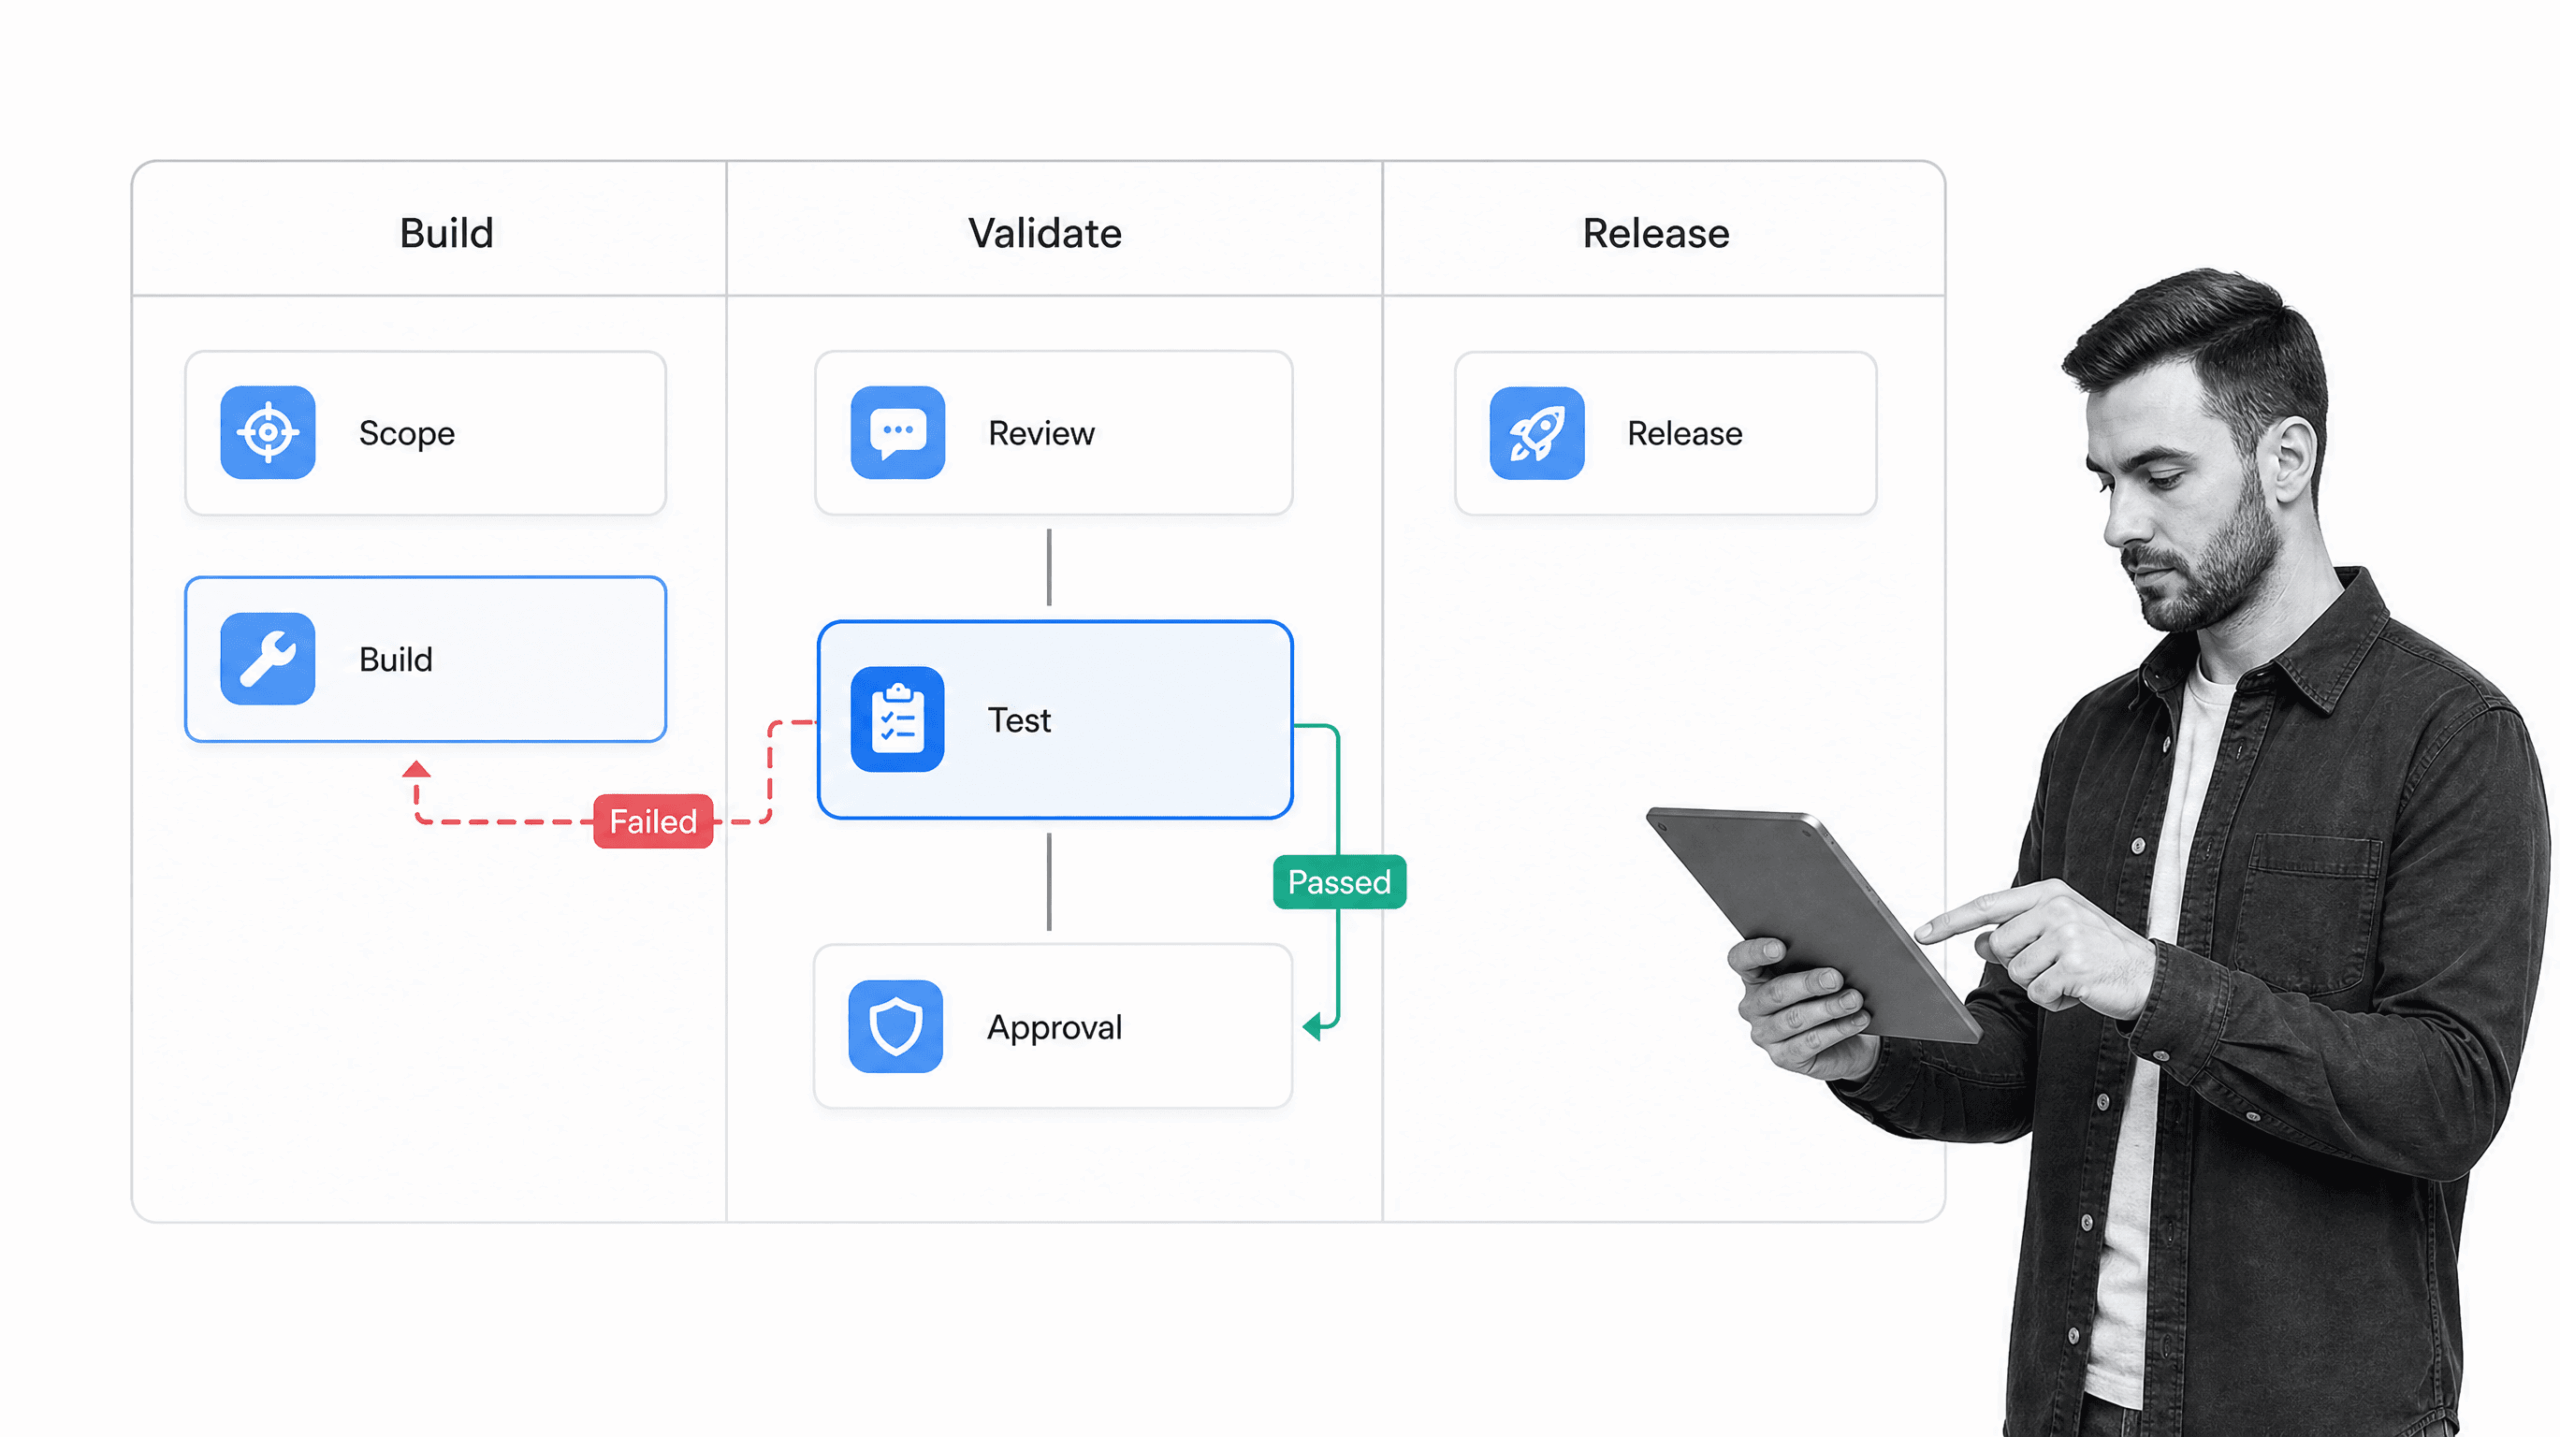
Build the diagram from observed work, not an ideal sequence invented in a conference room. The goal is to reveal the route people and systems use now, agree on the better route, and make the decisions explicit enough to test.
1. Define the question and audience
Write the question the diagram must answer. How does a customer-reported defect reach production? Where does security review enter a feature workflow? Which evidence is required before release? Then name the audience. One diagram should not try to serve engineers, executives, auditors, and integration developers at the same level of detail.
2. Set the start and end boundaries
Choose one trigger and one valid outcome. If there are several terminal states, show them clearly, such as Released, Rejected, Deferred, or Rolled Back. Boundaries make scope visible and stop the diagram from turning into a map of the entire software organization.
3. Observe the real path
Interview the people who do the work and inspect recent examples. Capture side messages, waiting, duplicate entry, hidden reviews, failed handoffs, and workarounds. The current-state diagram should be honest. If the team skips a step or uses a spreadsheet outside the official process, draw it before deciding whether to remove it.
4. List activities in plain language
Write each meaningful activity on a card before connecting anything. Use one action per card and start with a verb: Clarify scope, Build change, Review code, Run tests, Approve release, Deploy, Monitor. Combine tiny actions that do not change ownership, data, risk, or state.
5. Add owners or systems
Assign every activity to a person, role, team, service, or automated agent. If ownership changes often, use swimlanes. If the work is mostly system-to-system, label the component or service responsible for each action. Ambiguous ownership is a process defect, not a diagram formatting issue.
6. Connect the happy path
Connect the shortest route from trigger to outcome. A software development process flow template provides a practical starting structure from requirements and design through coding, testing, deployment, and maintenance. Keep the first pass linear so gaps are easy to see.
7. Add decisions and exceptions
Add only branches that change ownership, required work, risk, or outcome. Label every route. Include failed tests, rejected reviews, urgent changes, missing information, unavailable environments, security findings, and rollback conditions when they are material. Show where each exception rejoins the workflow or ends it.
8. Mark data and evidence
Identify what each step consumes and produces. A software development documentation workflow can help teams connect requirements, architecture, test results, acceptance, deployment, and post-implementation review. On the diagram, highlight the evidence that controls a decision or proves completion.
9. Place review and approval gates
Put gates at specific risks, not after every step. Architecture review may protect a hard-to-reverse decision. Security review may depend on data sensitivity or exposure. The OWASP threat modeling process uses system models and data flows to help teams identify threats, mitigations, and validation needs. Release approval may require passed tests, completed documentation, and a rollback plan. Name the approver or rule and show what happens after rejection.
10. Validate with realistic scenarios
Walk the diagram with a normal change, a failed test, a high-risk change, an urgent fix, and a rollback. Use an agile development process diagram to compare how iterative planning and feedback loops appear. If the team cannot trace a scenario without guessing, the diagram is incomplete.
11. Simplify and publish
Remove redundant shapes, crossing lines, unlabeled decisions, decorative icons, and detail that belongs in a linked procedure. Keep one flow direction where possible. Add a title, scope note, owner, and version outside the generated image asset when needed. Publish the diagram where the team finds the workflow, not in a separate archive nobody checks.
Software workflow diagram example
Consider a customer-reported defect. The trigger is a confirmed issue with reproducible evidence. Product clarifies impact and priority. Engineering assesses the affected component and builds a fix. Code review checks correctness and maintainability. Automated and manual tests verify behavior. Release approval confirms evidence and rollback readiness. Deployment moves the fix to production, and monitoring verifies the outcome.
The happy path
Confirmed issue leads to Scope, then Build, Review, Test, Approval, Release, and Monitor. The diagram labels the owner at each stage and the artifact produced: issue summary, change set, review decision, test evidence, approval record, deployment record, and monitoring result.
The exception paths
If scope is unclear, the work returns to Product. If review rejects the change, it returns to Build with comments. If tests fail, it returns to Build with evidence. If risk is high, it branches to Security Review before Approval. If monitoring detects harm, it follows the rollback path and opens a follow-up investigation.
What this example reveals
The diagram shows more than sequence. It shows which information controls routing, where responsibility changes, what can stop release, and how learning returns to the beginning. That makes it useful for onboarding, process improvement, automation planning, control review, and incident analysis.
Teams can pair the diagram with a Git workflow template or a software development automation workflow to translate the visual route into repeatable work.
How to review and maintain the diagram
A workflow diagram decays when the process changes but the picture does not. Give the diagram an owner, define what changes require review, and connect it to the workflow or procedure it represents. The owner should compare the diagram with recent cases instead of relying on memory.
Run a diagram review
Ask whether the trigger, outcome, activities, owners, decisions, exception paths, evidence, and controls still match reality. Trace at least one recent normal case and one exception. Check for steps completed outside the workflow, new systems, retired roles, changed approval rules, and automation that no longer behaves as drawn.
Use the diagram to find friction
Look for long queues, repeated returns, duplicated checks, excessive handoffs, unclear decision criteria, and controls that create delay without protecting a risk. The diagram gives the team a shared object for improvement. The data from real executions shows which suspected bottlenecks are actually costly.
Keep diagram and execution synchronized
Treat a change to the diagram as a proposed operating change. Test it before release, update the executable workflow, and record the decision. Process Street supports workflow previews so builders can test changes and advanced features before making them available to the team.
Turn a software workflow diagram into an executable workflow
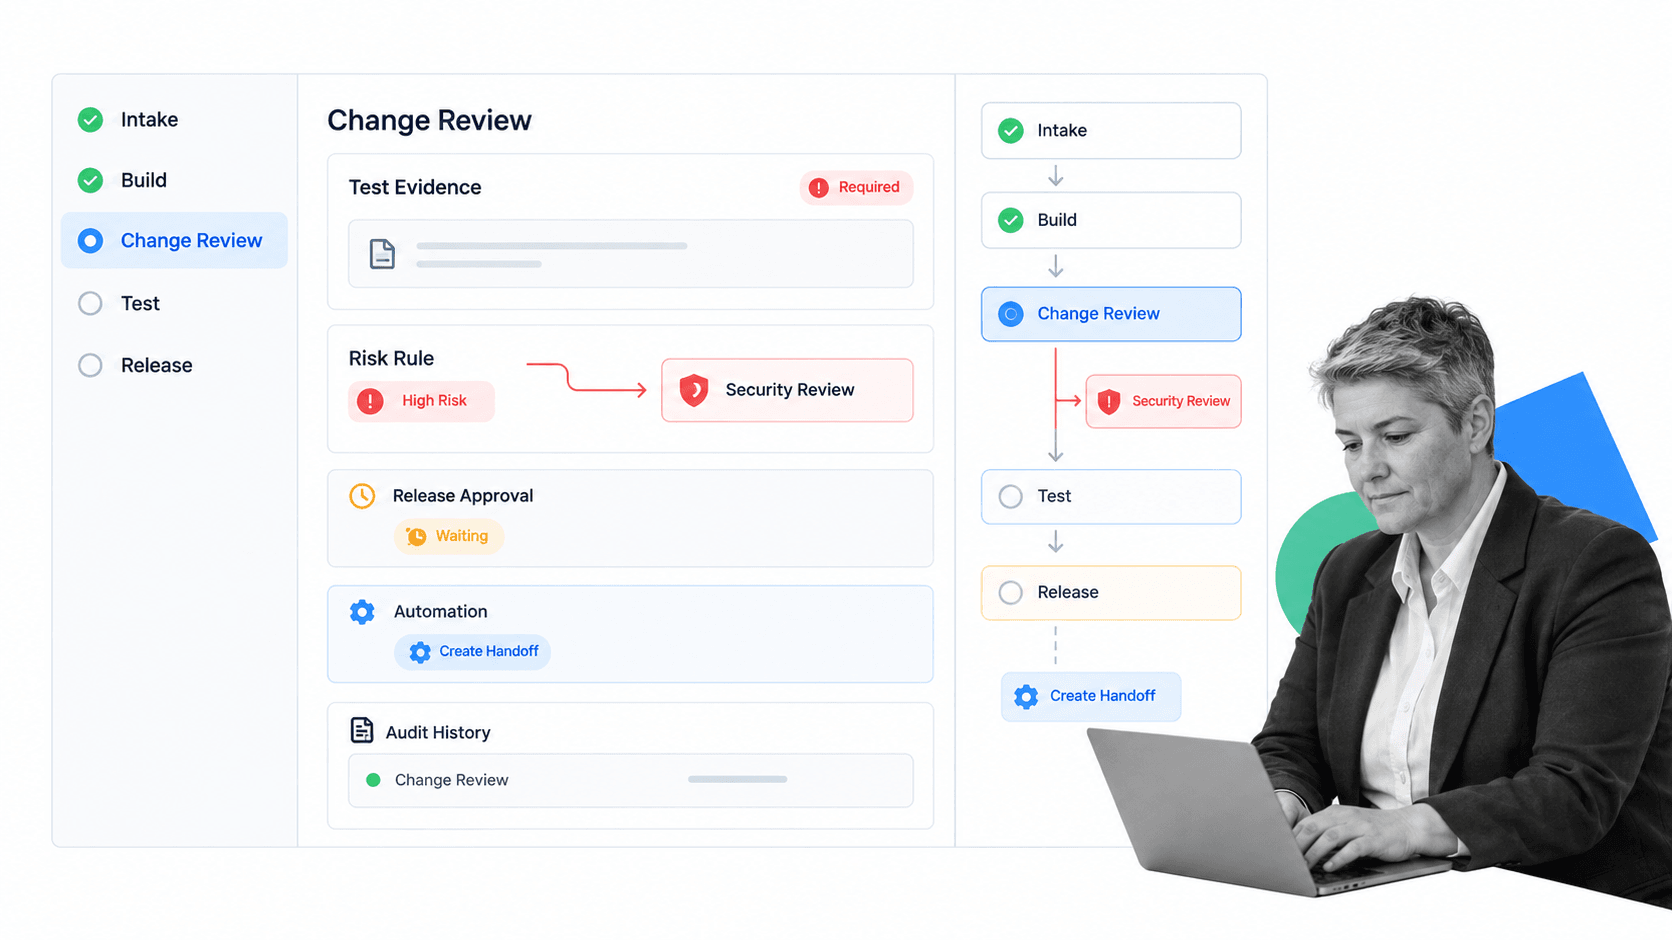
A diagram becomes operational when its nodes and branches control real work. Process Street is becoming an agentic process automation platform that turns a designed route into tasks, assignments, fields, due dates, rules, approvals, automation, and a record of execution.
Translate shapes into workflow controls
Turn each meaningful activity into a task or automated action. Turn swimlanes into roles or assignments. Turn decision labels into structured fields and rules. Turn evidence objects into required fields or attachments. Turn risk gates into approval tasks and stop points. Turn return arrows into clear rejection or remediation routes.
Make exception logic explicit
A diagram can show that high-risk work takes another route. The executable workflow must define the condition precisely. Process Street conditional logic can show or hide tasks and content based on workflow data or task state, which lets the runtime follow the route the diagram describes.
Connect people, systems, and agents
Some nodes belong to people, some to software systems, and some to AI agents. The executable workflow should identify the actor, inputs, allowed actions, success condition, failure path, and human oversight for each step. This is where a clear diagram helps: it exposes the boundaries before automation makes mistakes faster.
Capture proof and improve from execution
The workflow run records which path a case followed, who completed each task, which evidence was supplied, which approvals occurred, and which automations ran. Compare that history with the diagram. If real cases repeatedly take an unmodeled route, update the process. If a branch never occurs, ask whether it is unnecessary or impossible to trigger.
Start with one bounded process
Choose a workflow with a clear trigger, outcome, exception, and review gate. The software design workflow and workflow diagram software guide provide adjacent detail for design decisions and diagram tooling. Build the simplest executable path, test realistic cases, then expand only when evidence shows the need.
FAQs
What is a software workflow diagram?
A software workflow diagram is a visual map of how software work moves from a trigger to an outcome. It shows stages, tasks, owners, decisions, data, exceptions, review gates, and feedback loops so a team can understand and improve the process before automating it.
What should a software workflow diagram include?
Include a clear trigger and outcome, meaningful activities, owners or swimlanes, labeled decision branches, important data or evidence, exception paths, review gates, and feedback loops. Show only the detail needed to answer the diagram’s main question.
How do you create a workflow diagram for software development?
Define the audience and scope, observe the real process, list activities, assign owners, connect the happy path, add decisions and exceptions, mark evidence and controls, and validate the result with realistic scenarios. Simplify the final diagram until a new reader can trace it without guessing.
What is the difference between a workflow diagram and a flowchart?
A workflow diagram is a type of flowchart focused on how work moves between activities, people, teams, and systems. Flowcharts can represent many other kinds of logic, including algorithms, decisions, data transformations, and system behavior.
When should a team use BPMN or a UML activity diagram?
Use BPMN when formal process events, messages, gateways, participants, or executable semantics matter. Use a UML activity diagram when the main focus is software behavior, concurrent actions, object flows, or system interactions. For simple shared understanding, a basic flowchart or swimlane diagram is often clearer.
How do you turn a software workflow diagram into an executable workflow?
Translate activities into tasks or automations, lanes into assignments, decisions into structured rules, evidence into required fields, and review gates into approvals or stop points. Then test the normal path and every important exception before releasing the workflow to the team.