
Universal Modeling Language (UML) is a way of visualizing a software program using a collection of diagrams. That is perhaps the simplest way to define it.
If you’re looking for a full-winded definition, here it is:
“The Unified Modeling Language (UML) was created to forge a common, semantically and syntactically rich visual modeling language for the architecture, design, and implementation of complex software systems both structurally and behaviorally.” – Lucidchart, What is Unified Modeling Language
UML has many advantages including flexibility, an abundance of tools, and the capacity to model systems from both a structural and behavioral perspective.
Nevertheless, it can sometimes be overwhelming.
A focus on simplicity is, therefore, essential to not only creating actionable diagrams, but also to avoid pulling your hair out in the process!
Finding simplicity in complexity is the way to go
Before we dive into this tutorial we must acknowledge that UML is a huge topic. Since it was created in 1994 by Grady Booch, Jim Rumbauch, and Ivar Jacobson, a tremendous amount of information has been created to explain the vast capability of its application in software development.
It is also widely accepted that UML is incredibly complex. Just read a small portion of the introduction from this academic research paper:
“UML specification is a huge book (732 pages), the UML metamodel is large and quite complex, and the definition and the understanding of its static and dynamic semantics is a truly difficult task, with also the consequence to make difficult to teach it both at the school/university level or in the industry (Grossman et al., 2005).” – What Are the Used Activity Diagram Constructs?
Despite its complexity, UML does not need to be leveraged in a complicated fashion for it to be useful. In fact, one of the men who created the language believes it should be used rather casually.
“Seriously, you need about 20% of the UML to do 80% of the kind of design you might want to do in a project – agile or not – but use the UML with a very light touch: use the notation to reason about a system, to communicate your intent to others…and then throw away most of your diagrams.” – Grady Booch
So, the key takeaway from that, at least as I see it, is to keep things as simple as possible when planning and creating UML diagrams. I find this to be particularly important when it comes to modeling business processes, which is going to be the focus of this post.
The use of UML in business process modeling
Business process modeling is the act of documenting the series of steps and actions taken within a business process. This involves:
- Identifying the actors involved and the roles they play in the process
- Showing how the actors interact with each other through the progression of various activities
- Providing a clear picture of the journey it takes through the organization
So, why is keeping things simple important when using UML to model business processes?
The short answer is so that people reviewing and implementing the processes are not unnecessarily confused and prone to misunderstanding information. This may seem obvious, or trivial, but the tendency for diagrams to get overwhelming and confusing is repeatedly cited as being a significant drawback of using UML.
Thankfully, the application of UML in process modeling is significantly limited in how complicated it can be in comparison to its application in software engineering or development.
This is because UML was not originally created to model business processes, it was purely a software development tool until it became apparent that a small set of diagrams, one in particular, can also be used to effectively model business processes. Using UML to align the work of software developers and business analysts has proven beneficial for product development.
By having the business analyst and system developers using the same modeling concepts, the risk of costly errors related to different understanding of methodology concepts is significantly mitigated. – Business Modeling with UML: A Business Process Centred Architecture
In this post, I’m going to provide a brief overview of the 2 main types of UML diagrams, explain why the activity diagram works best for process modeling, and walk you through a step-by-step guide to modeling processes with activity diagrams.
We’ll then take a look at a few other examples and finish by discussing how you can use your diagrams to drive productivity in your organization.
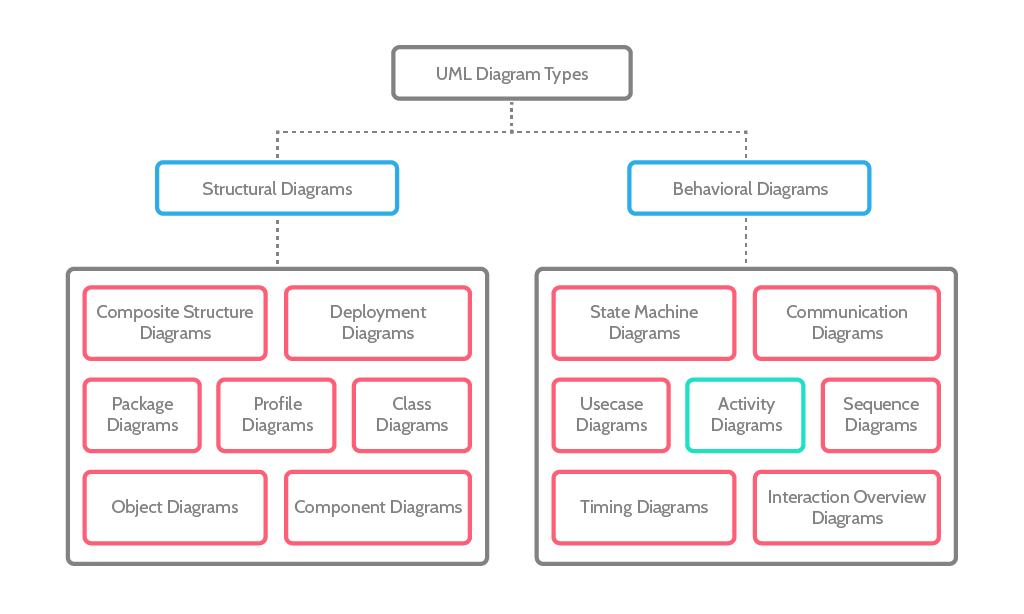
A quick look at the 2 main types of UML diagrams
Structural diagrams
Structural diagrams represent the static aspect of the software system. As the name suggests, they are focused on the system’s underlying structure. The 4 main types of structural diagrams are:
- Class Diagram
- Object Diagram
- Component Diagram
- Deployment Diagram
By far the most commonly used, as you may well already know, is the class diagram. From a software development perspective, it is one of the most useful UML diagram types because it clearly maps out the structure of a system by modeling its classes, attributes, operations, and relationships between objects.
In other words, it holds the ability to provide both detailed insight and a quick, big-picture overview of a system’s structure, making it the foundation for creating systems.
Behavioral diagrams
Behavioral diagrams, on the other hand, visualize, specify, construct, and document the dynamic aspects of a system.
The most commonly used behavioral diagrams are:
- Use Case Diagram
- Sequence Diagram
- Activity Diagram
A use case diagram is designed to demonstrate how users might interact with a system. Users (also known as actors) include people, organizations, or external systems. Use case diagrams are not intended to be complicated, but rather to give a clear picture of how users are interacting with a particular system and whether or not those interactions are happening as intended.
Sequence diagrams are used to show how objects communicate and in what sequential order. They are perhaps the most commonly used interaction diagram.
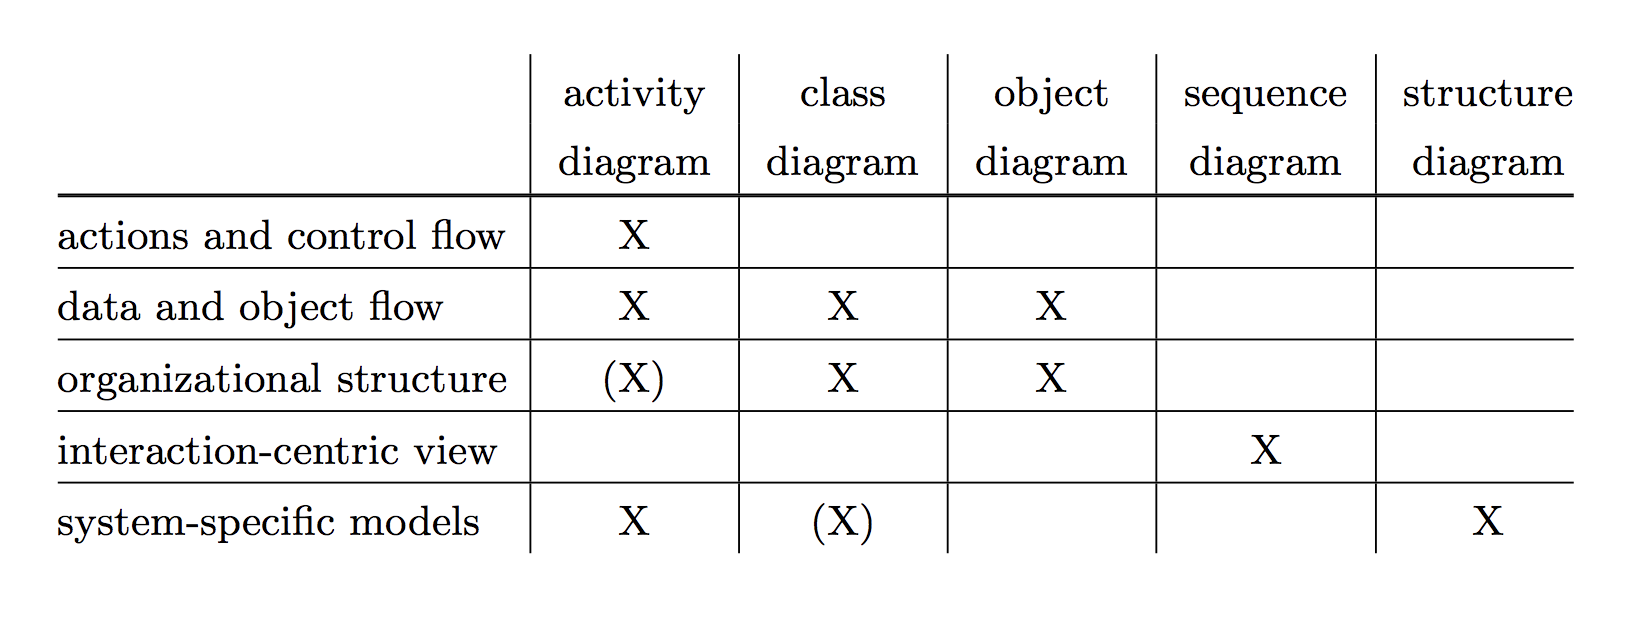
Activity diagrams are also very popular, and are just what we need for modeling business processes because they are the only type of UML diagram that accounts for the flow of actions.
As seen from the graphic below, the activity diagram is the second most commonly used diagram, closely following the class diagram.

Let’s dig into what this diagram is, why it works, and how to put one together.
The diagram most suitable for process modeling
The activity diagram, also known as a swim-lane diagram or cross-functional flowchart, describes how a set of activities are coordinated to provide a service.
It is the most suitable diagram for business process modeling as it neatly illustrates the flow of a process from activity to activity. It is essentially an advanced version of a flow chart, making it an ideal tool to represent business workflows.
3 main benefits of activity diagrams
- Activity diagrams are generally far less complicated than other UML diagrams, making them easier for both analysts and stakeholders to fully comprehend.
- They allow an analyst to display multiple conditions and actors within a workflow through the use of swimlanes.
- They have the ability to clearly describe the steps performed in a UML use case
Overview of the basic components
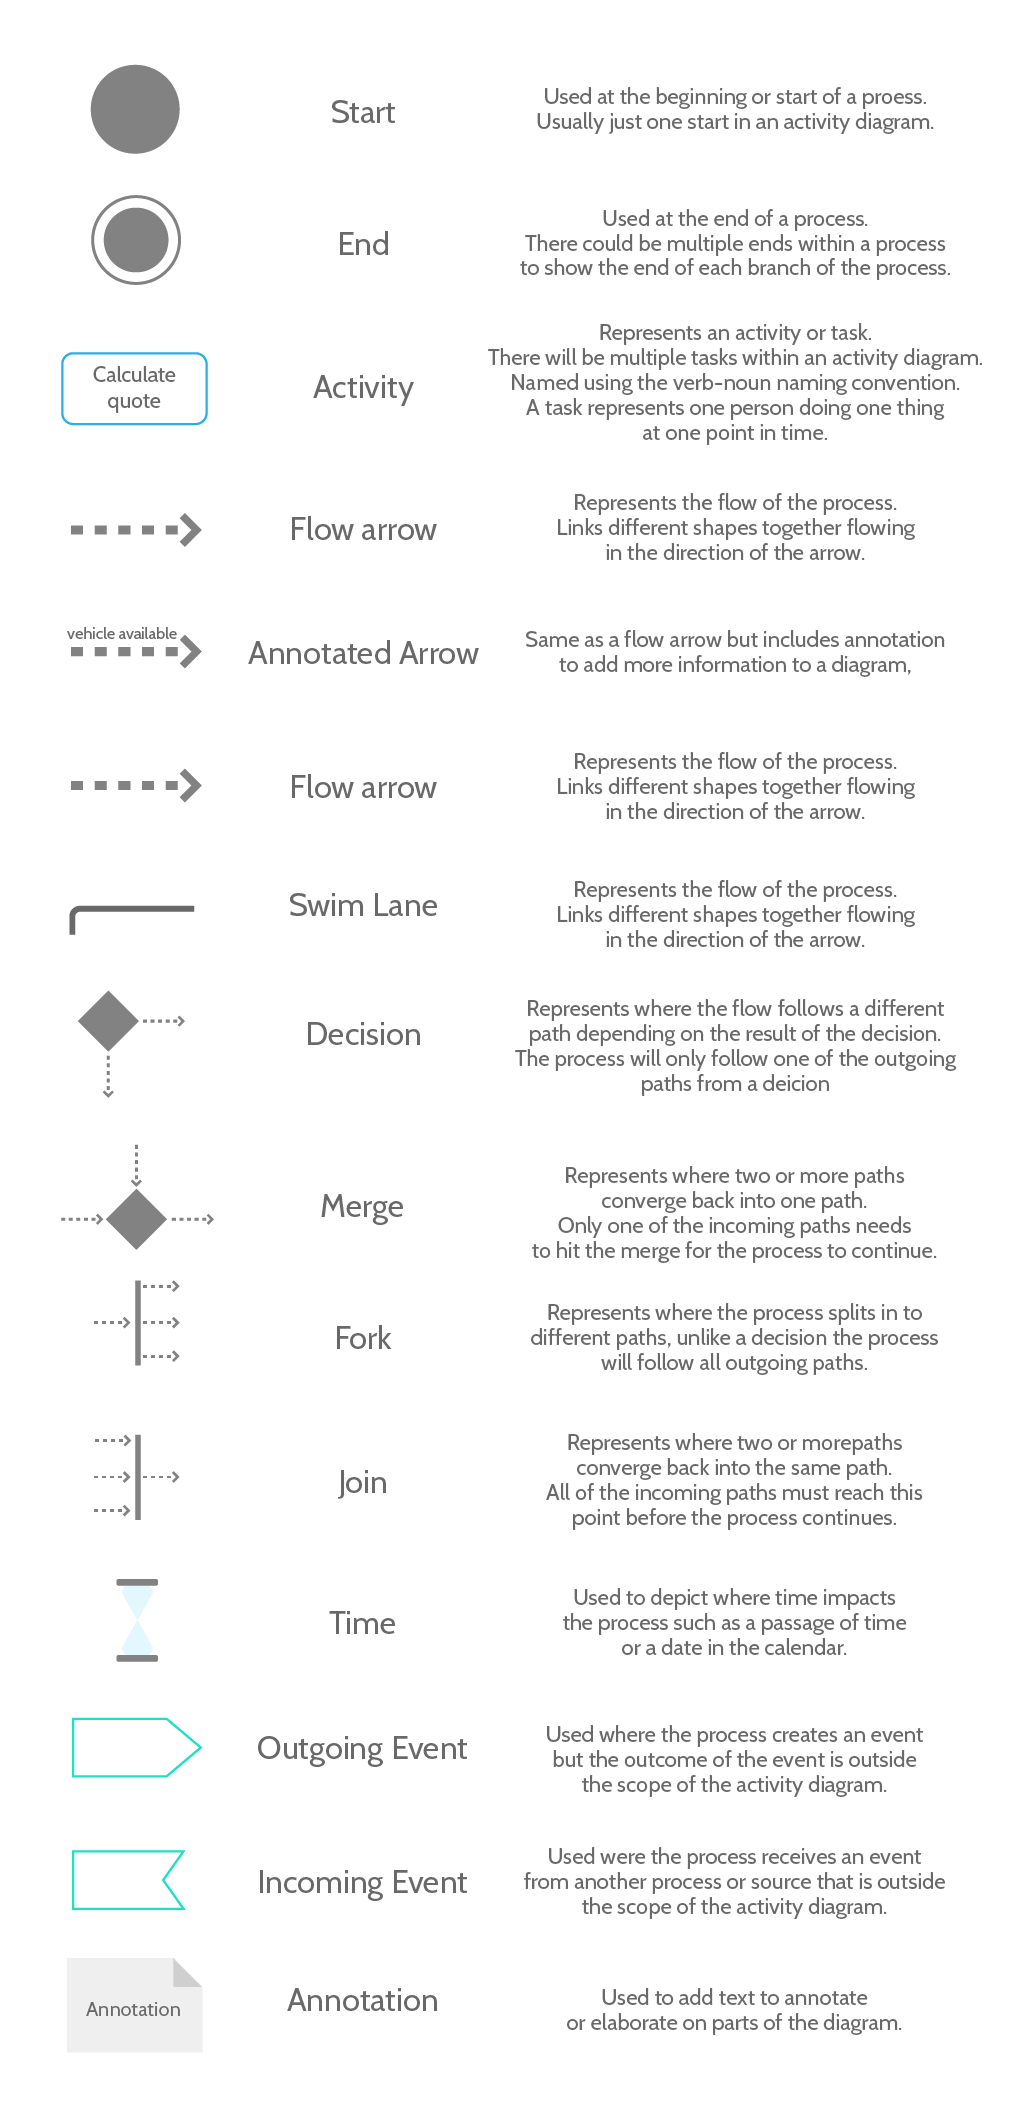
- Start node: Symbolizes the beginning of the activity, represented by a black circle.
- Action: A step in the activity wherein the users or software perform a given task, represented by a rectangle usually with rounded edges
- Decision node: A conditional branch in the flow that is represented by a diamond shape. It includes a single input and two or more outputs
- Control flows: The connectors that show the flow between steps. These include connector arrows, the join symbol, and the fork symbol
- End node: Symbolizes the end state of an activity and represents the completion of the process.
Overview of the symbols
A high-level overview of the diagram creation process
According to the UML tool provider, Visual Paradigm, the following 5 steps need to be followed to create effective activity diagrams.
- Identify candidate use cases, through the examination of business workflows
- Identify pre- and post-conditions (the context) for use cases
- Model workflows between/within use cases
- Model complex workflows in operations on objects
- Model in detail complex activities in a high-level activity diagram
A 10-step guide to modeling processes with UML activity diagrams
The completed activity diagram of the example I am about to go through is presented at the end of the step-by-step guide.
Feel free to review it before reading through the steps, although I would recommend reading through the steps first. This will help you visualize how some of your processes would be modeled before seeing the finished product.
Preparation
Step 1: Determine the process
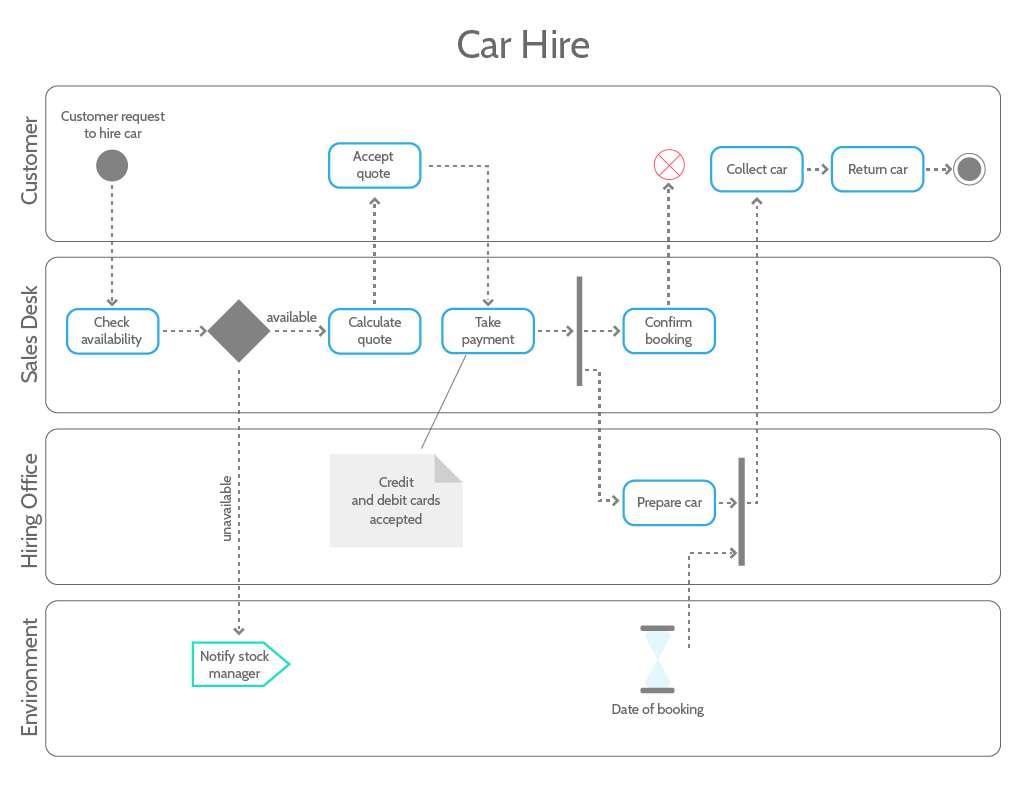
Firstly, we need to choose a specific process. Let’s say we want to map out the process for hiring a car.
Step 2: Identify the actors (swimlanes)
In this case, there are 3 actors – the customer, the sales desk, and the hiring office. Each of these 3 actors will represent a swimlane.
Don’t worry if you feel unsure about exactly which actors are involved in the process. It’s ok to identify actors as you map out the various activities.
Step 3: List all activities/tasks that need to be completed
Make a list of all the activities/tasks that need to be completed in order for the process to reach the desired outcome when it ends. This can also be done as you work through the model, but ideally list everything beforehand as you may identify opportunities to streamline the process.

Creating the diagram
Step 4: Name the start node and place it in the top left corner of the diagram
The start node, symbolized by a black circle, needs to be named and placed in the top left corner of the model, in the first swimlane. The swimlane at the top of the diagram belongs to the actor who begins the process, which in this case is the customer. The node is named “Customer request to hire car”.
Step 5: Insert the first activity
Once the first actor has begun the process, what is the first activity or task that needs to be completed? In the case of our example, the task is “Check availability” and is to be completed by the sales desk (second swimlane).
Step 6: Begin connecting activities with connector arrows, placing fork and join nodes where necessary
This is when the model will start to take shape. Place a connector arrow between each activity. For activities that need to be split into different paths, insert a fork node. Where two or more paths converge back into the same path, insert a join node.
Step 7: Integrate decision and merge symbols where appropriate
Following an activity such as “Check availability”, a decision needs to be made as there is a possibility that a car is available or unavailable. Depending on the result, the process will change.
Step 8: Integrate outgoing/incoming symbols where appropriate
These symbols are also referred to as send and receive symbols. Insert an outgoing symbol where a certain activity creates an event for which the outcome is outside the scope of the diagram. In the case of our example, an outgoing symbol titled “Notify stock manager” is created if a car is unavailable as this is an activity that needs to take place but how the stock manager deals with the situation is irrelevant to the car hire process.
An incoming symbol should be inserted where the process receives an event from another process our source that is outside the scope of the diagram
Step 9: Add annotations where appropriate
Annotations should be used conservatively. It can be tempting to insert a bunch of annotations in an attempt to clarify activities but this can cause confusion and create a messy diagram. Only add them where critical information needs to be represented.
You will notice that our example contains only one annotation, referring to accepted methods of payment which is obviously an important piece of information.
Step 10: Verify that the final activity completes the process and connect it to the end node
Do a final check to make sure that the final activity completes the process, and add a connector arrow to the end node. All done! Now it’s time to review the diagram and ensure that no steps have been missed.
A couple of other examples
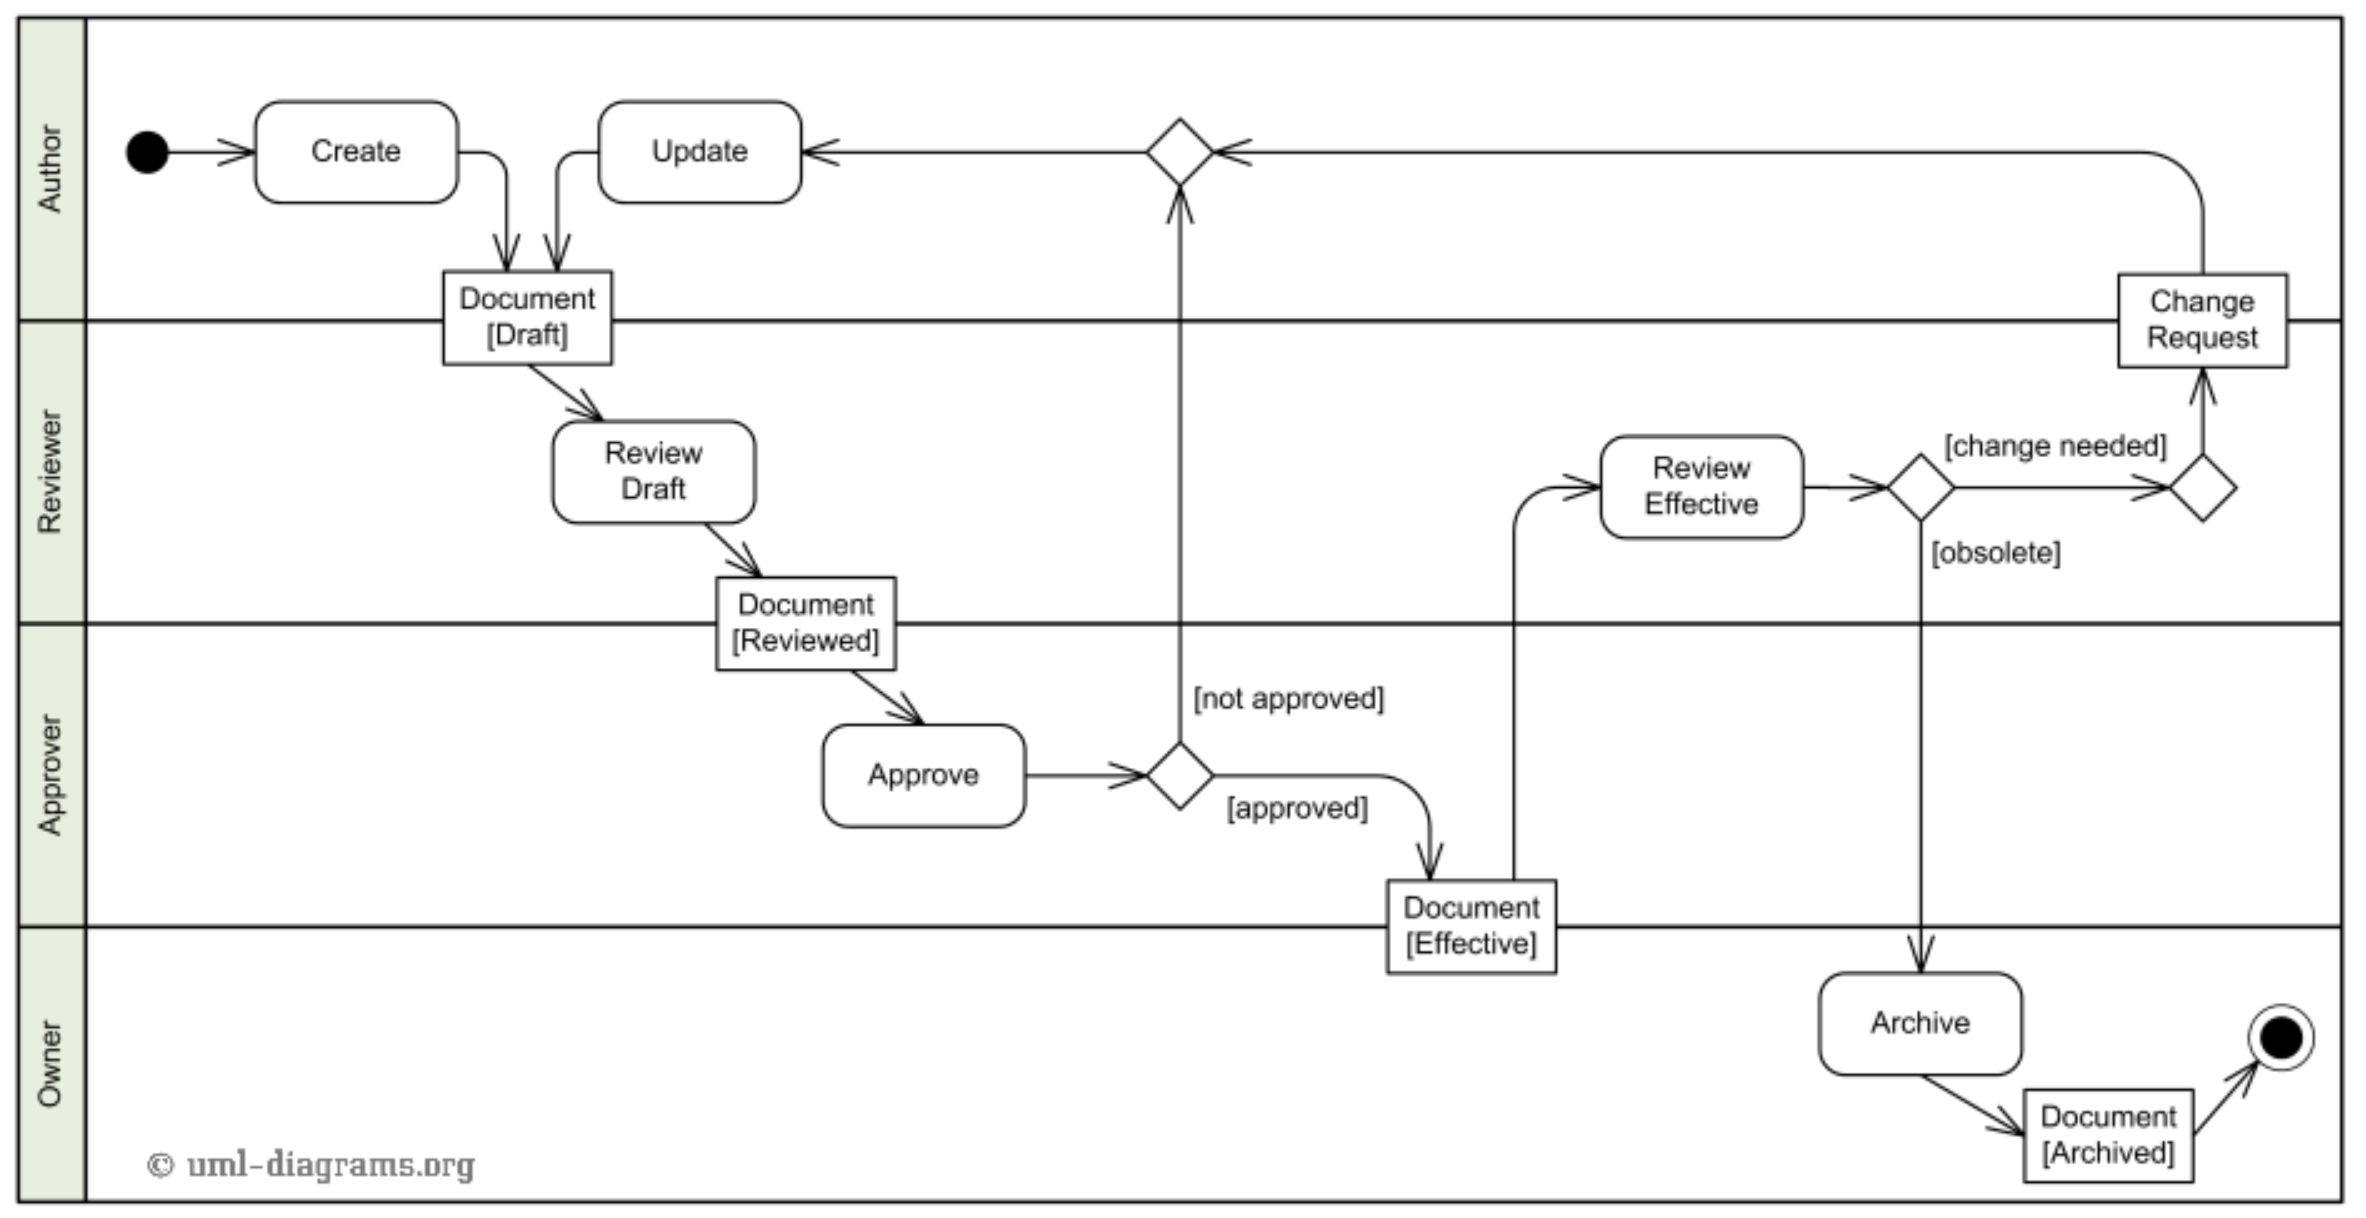
Document management process
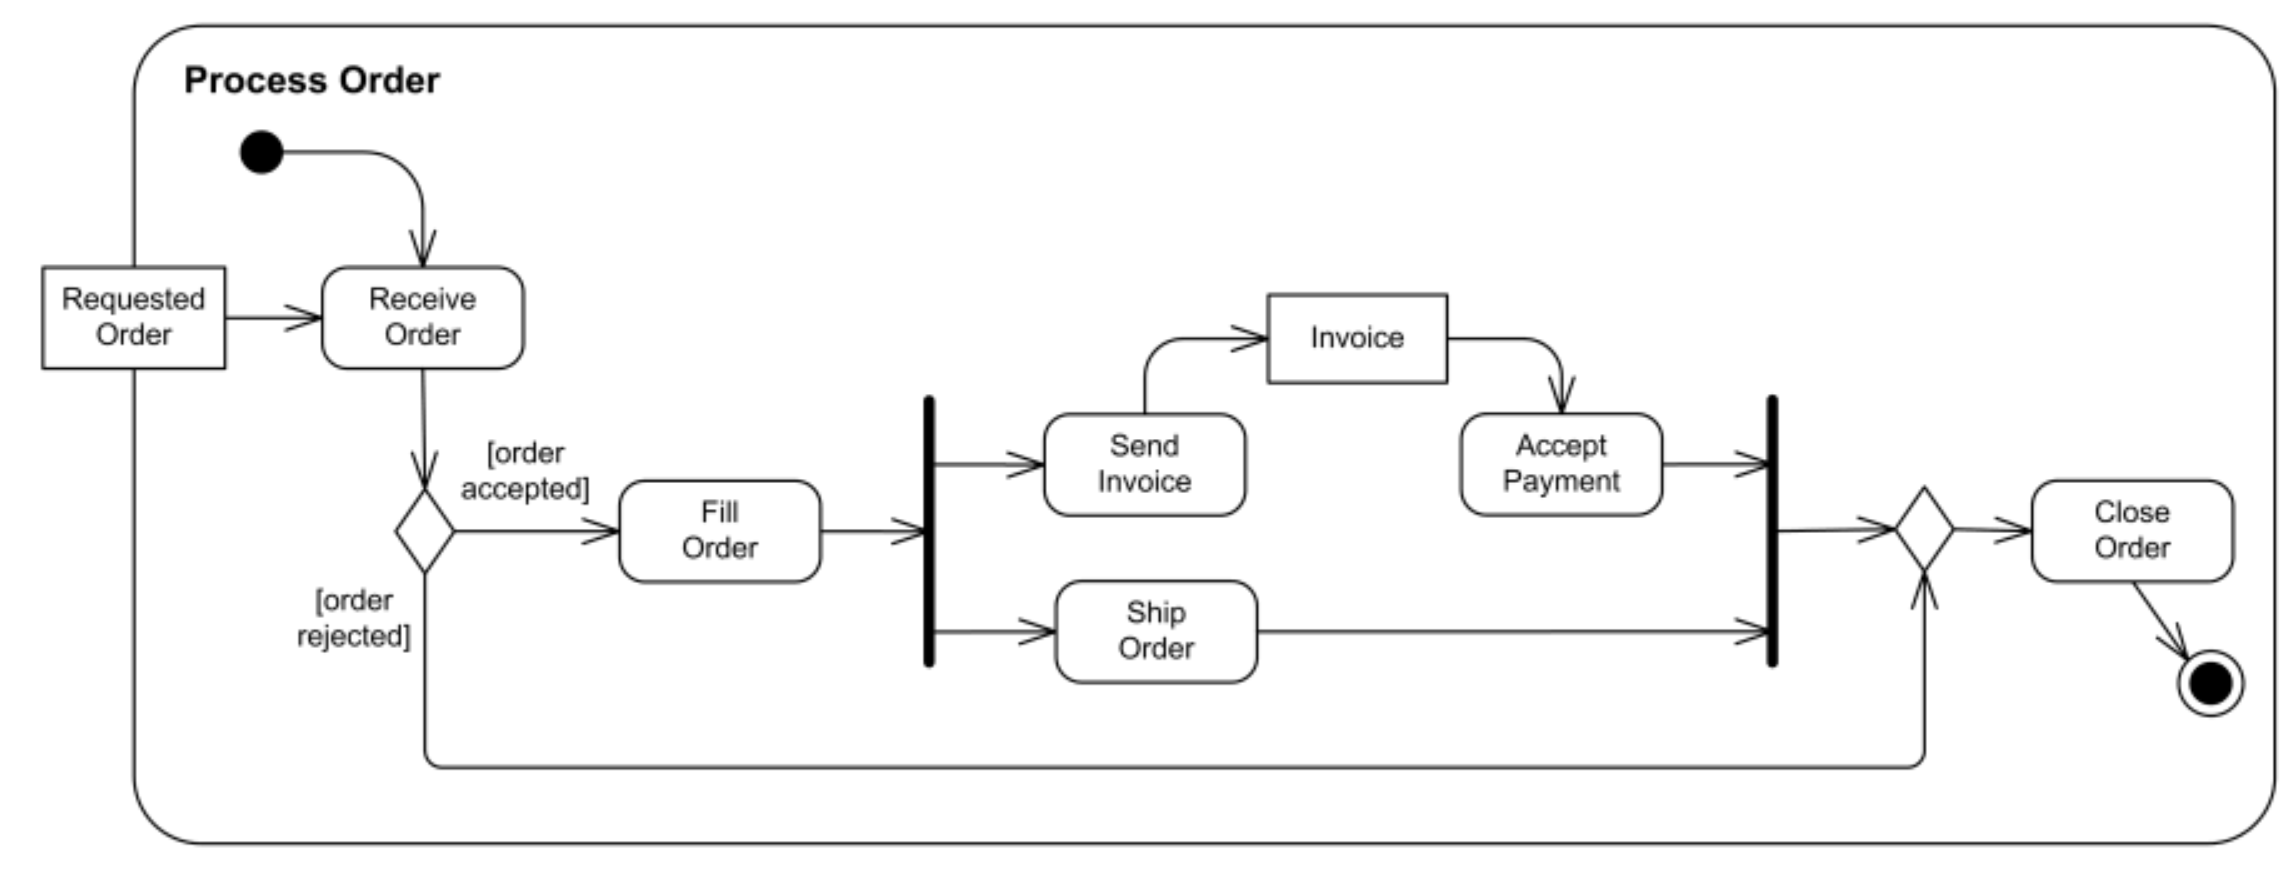
Order processing
Tools for drawing UML diagrams
There are a vast amount of software tools out there for drawing UML diagrams. Which one is the best is, of course, a topic of debate.
Here is a short list of a few that have received great feedback from its users:
Check out this list for more options.
BPMN is also a popular choice for modeling business processes, and can be drawn using the tools named above. If you are debating whether to use UML or BPMN or would like to learn more about how to use BPMN, check out our BPMN tutorial.
Using your diagrams to drive productivity
Results from a 2015 research study found that among the 47 activity diagrams constructs that were evaluated, a large majority of them seem to be scarcely used, while, only nine were widely used. That’s just below 20%.
Once they have been created and reviewed by various stakeholders, activity diagrams can easily be swept under the rug. But why waste your time and energy creating a model that ultimately has no impact on business performance?
With a simple business process management tool like Process Street, you can implement your diagrams by instilling the process in a checklist. We have hundreds of pre-made templates to choose from to help you get started.
Process Street’s workflow features make it possible to convert your UML activity diagrams into repeatable, executable processes. Tasks can be automatically assigned to team members, data to and from various tools that you already use can be automatically populated through our 1000+ integrations, and all activity can be tracked in a dashboard.
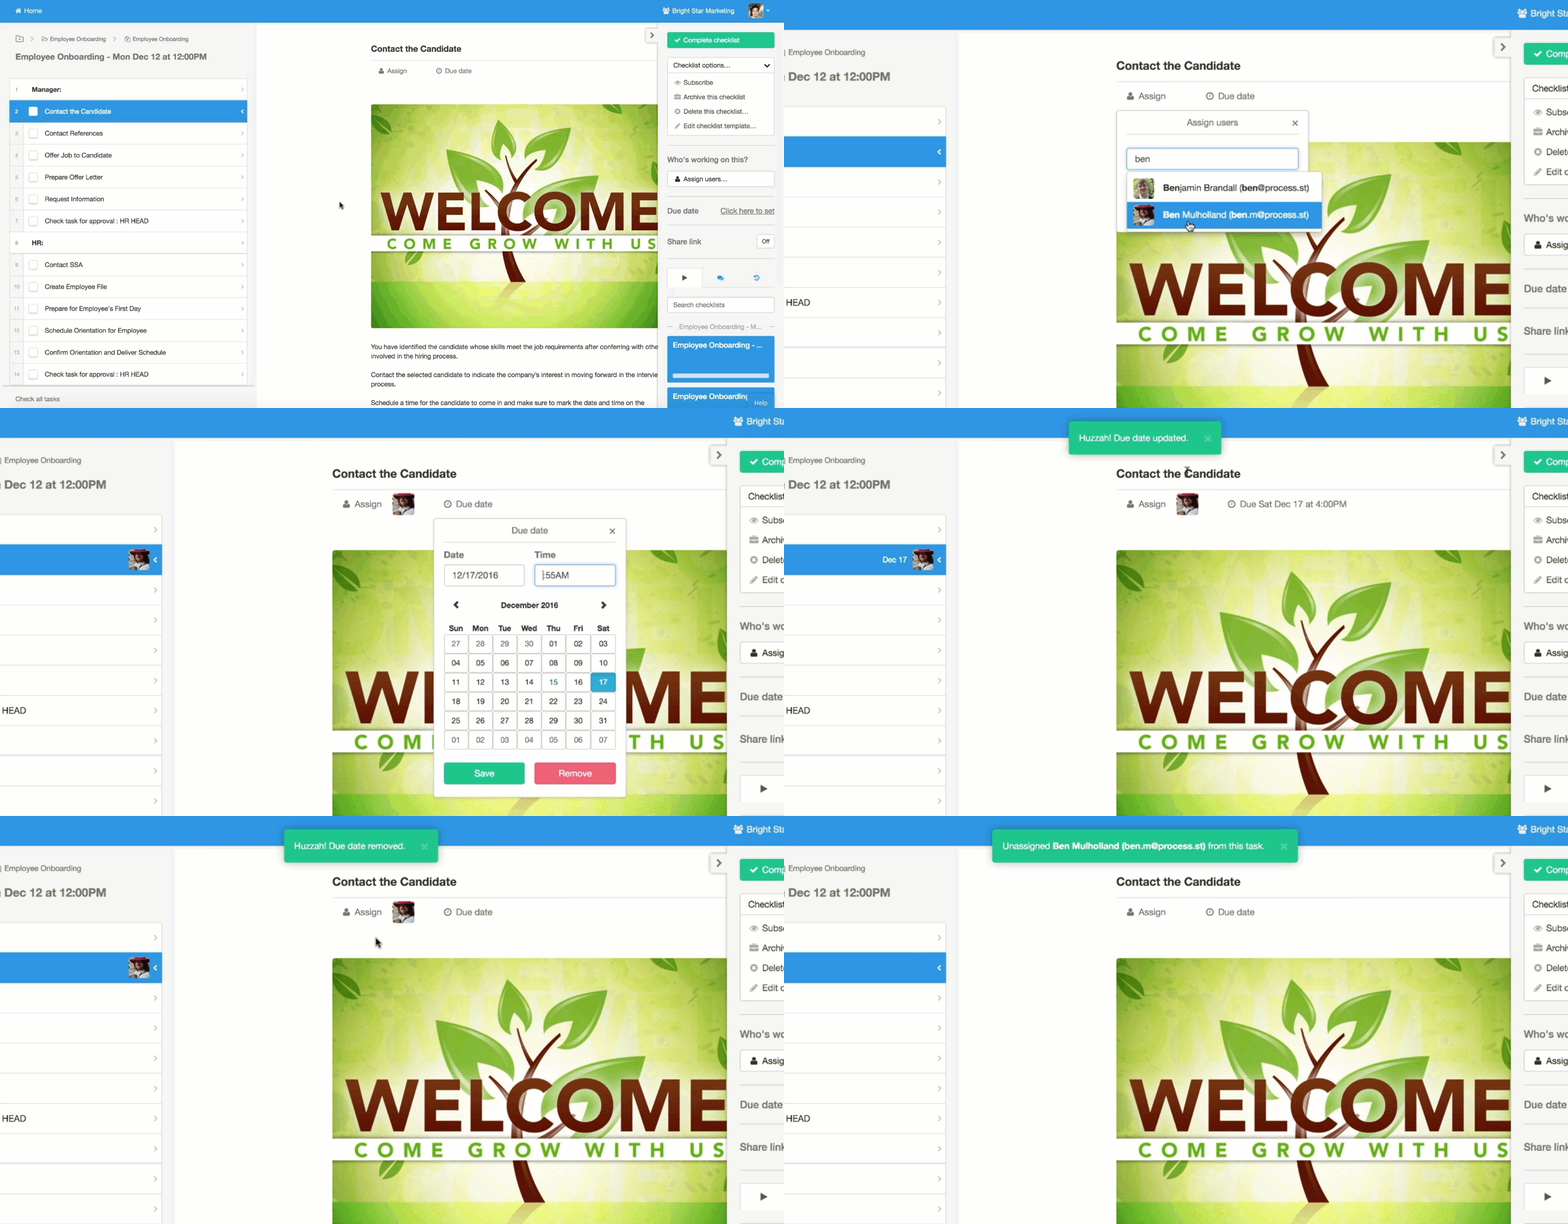
By using our conditional logic feature, you can create truly dynamic checklists that adapt to the unique needs and circumstances of your organization.
When a decision node in your activity diagram is reached, the process will branch out to different activities depending on which decision is made. That is precisely what conditional logic enables you to do, so the checklists will automatically adapt to the situation as decisions are made.
I hope you found this tutorial helpful! If you have any thoughts regarding the use of UML (or BPMN) to model business processes, please share them in the comments below!


 Workflows
 Projects
 Data Sets
 Forms
Forms Pages
Pages Automations
 Analytics
 Apps
Apps Integrations
 Property management
 Human resources
 Customer management
 Information technology


Alex Gallia
Alex is a content writer at Process Street who enjoys traveling, reading, meditating, and is almost always listening to jazz or techno. You can find him on LinkedIn here