


Turn every policy into automated workflows with built-in enforcement and audit-ready proof.



15 Best Business Analyst Tools

Business analysts turn unclear requests into requirements, process designs, evidence, and decisions. The right business analyst tools make that work traceable. They help teams capture what stakeholders need, see how work actually moves, test assumptions with data, and carry an approved design into day-to-day execution.
No single application is strongest at every part of the job. A practical stack usually combines a controlled workflow platform with focused tools for spreadsheets, business intelligence, diagramming, wireframing, requirements management, and collaborative planning. The goal is not to collect software. It is to create a reliable path from discovery to implementation.
This guide compares 15 business analyst tools by the job each one performs best. It also explains how to choose a compact stack that supports analysis without creating duplicate records or uncontrolled handoffs.
What does a business analysis toolkit include?
Business analyst tools are applications used to discover, document, analyze, communicate, and operationalize business needs. The IIBA Business Analysis Standard describes business analysis as enabling change by defining needs and recommending solutions that deliver value. Software supports that work, but the value comes from choosing the right surface for the decision at hand.
- Workflow and process execution: turns approved procedures into assigned, trackable work.
- Data analysis and visualization: tests assumptions, exposes trends, and communicates evidence.
- Requirements and traceability: connects needs to designs, tests, changes, and approvals.
- Process mapping and modeling: makes activities, decisions, roles, and exceptions visible.
- Collaboration and planning: creates a shared working space for discovery and delivery.
- Wireframing: gives stakeholders something concrete to review before development begins.
A good tool helps answer a specific question: What is happening? What should happen? What evidence supports the change? Who owns the next action? What must be controlled after launch? Those questions are more useful than a long feature checklist.
Which capabilities fit each business analysis job?
Start with the output your stakeholders need. Choose Process Street when the analysis must become an owned, controlled workflow. Use spreadsheet and BI tools when the main task is testing data or explaining performance. Choose diagramming software when the team needs to agree on sequence, responsibility, or system behavior. Use dedicated requirements platforms when traceability and formal review are central.
- Process Street: controlled workflow execution and process governance
- Microsoft Excel, Microsoft Power BI, Tableau, and Google Looker Studio: analysis and visualization
- Jira, Confluence, and Smartsheet: collaborative planning and delivery visibility
- Lucidchart, Miro, Microsoft Visio, and Bizagi Modeler: process mapping and modeling
- Balsamiq: low-fidelity interface wireframes
- Jama Connect and Modern Requirements4DevOps: structured requirements and traceability
The strongest stack has one clear system of record for each artifact. Decide where a requirement lives, where an approved process lives, and where execution is tracked. Integrations should connect those records without turning every application into a competing source of truth.
What are the best business analyst tools?
Process Street
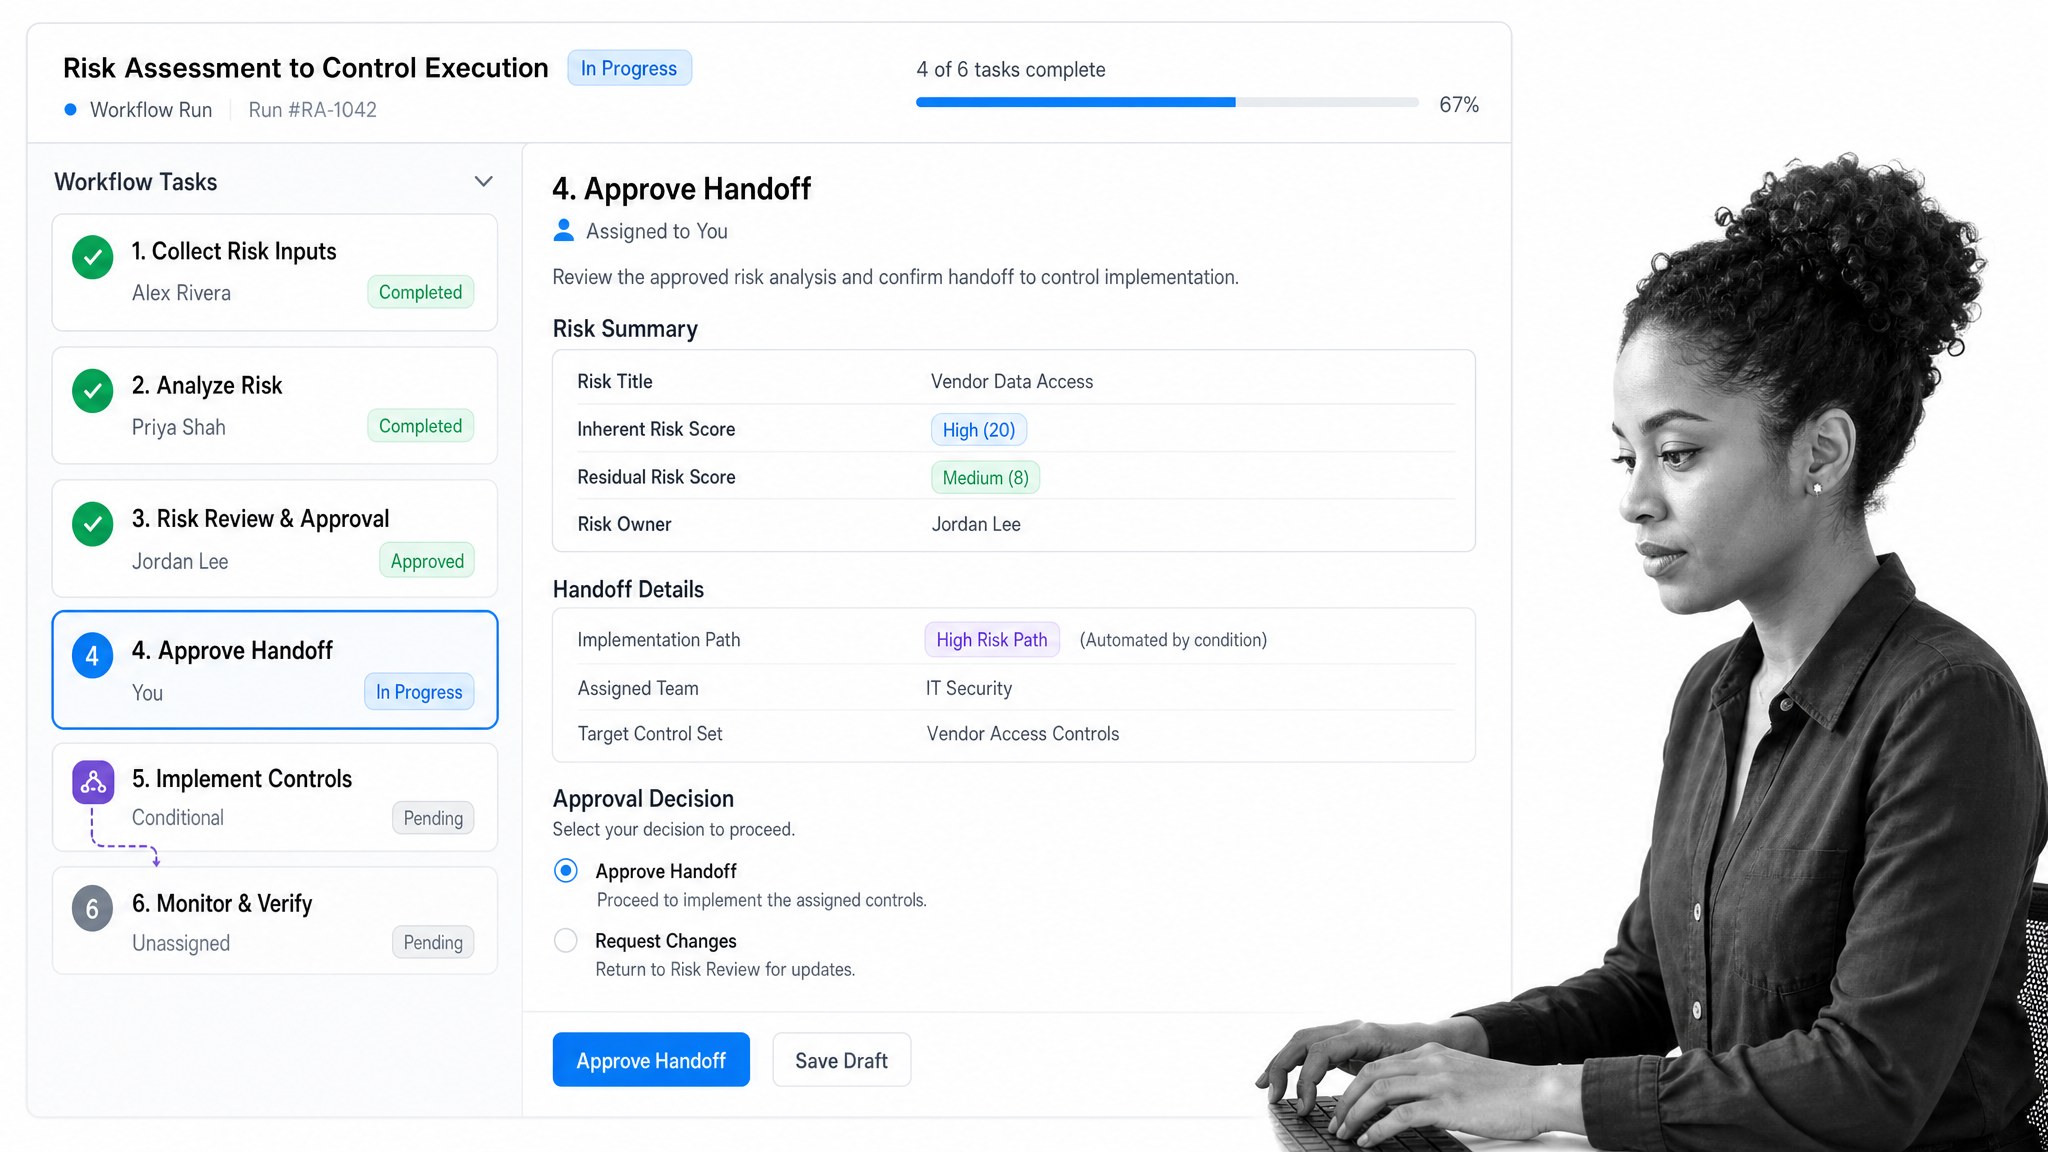
Process Street is best for turning analysis into controlled, repeatable execution. A business analyst can document the target process, structure its steps, capture required data, assign responsibilities, and make progress visible in one operational workflow. Conditional logic can adapt the path to the information supplied, while approvals and automations help govern handoffs.
That execution layer matters because a process map is only a model. Teams still need a dependable way to perform the process, manage exceptions, and learn from the record of completed work. Process Street connects process documentation with workflow management, making it the category holder for analysts who need their recommendations to operate consistently after approval.
Microsoft Excel
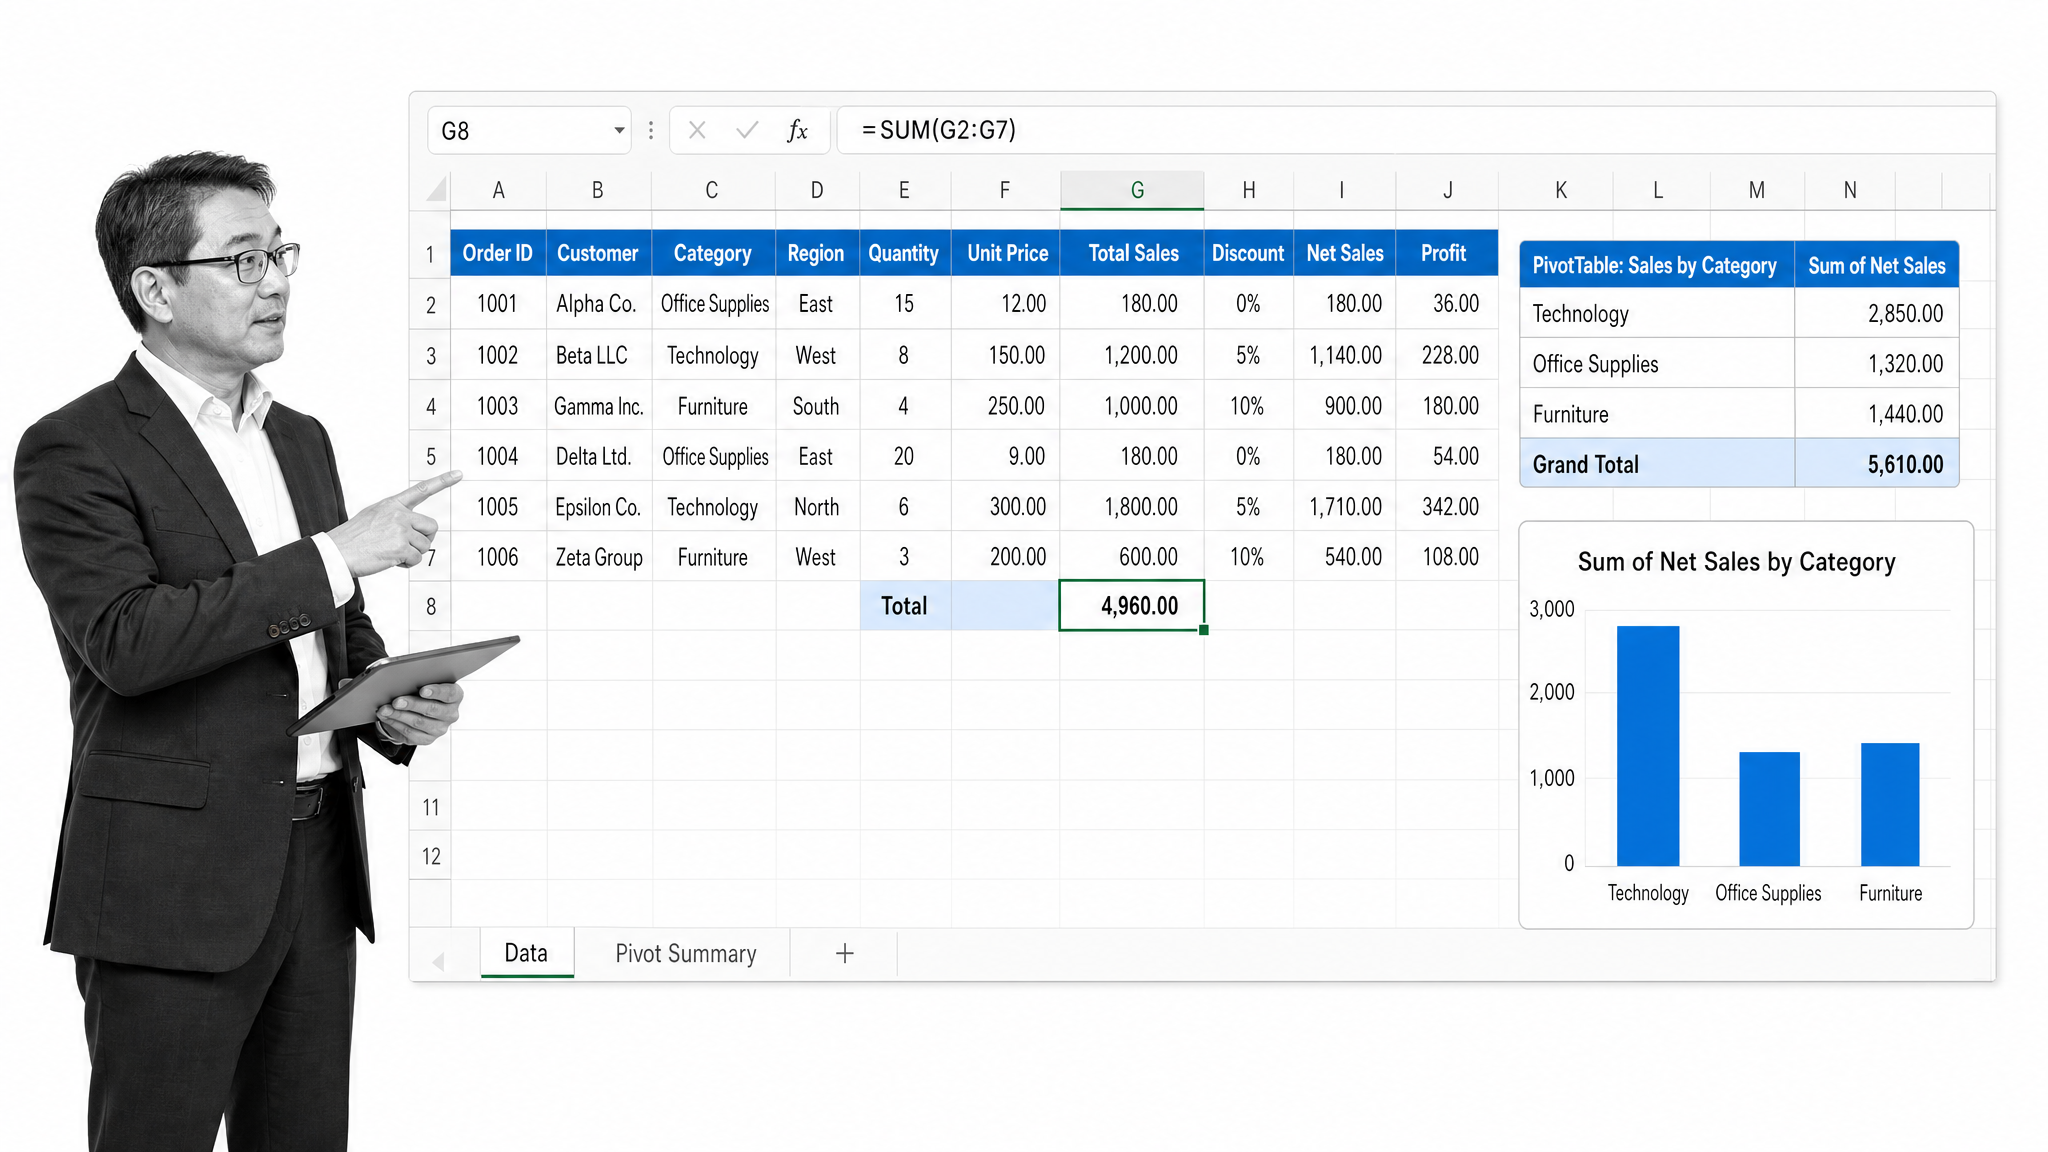
Microsoft Excel is best for rapid, flexible analysis of structured data. Business analysts use tables, formulas, charts, PivotTables, and Power Query to clean information, compare scenarios, inspect outliers, and build an auditable calculation trail. The Analyze Data feature can also answer natural-language questions and suggest visual summaries.
Excel works especially well during discovery, when the model is changing quickly and the analyst needs direct control over the logic. Its flexibility also creates governance risk, so define ownership, protect critical formulas, document assumptions, and move recurring operational steps into a controlled workflow once the analysis stabilizes.
Microsoft Power BI
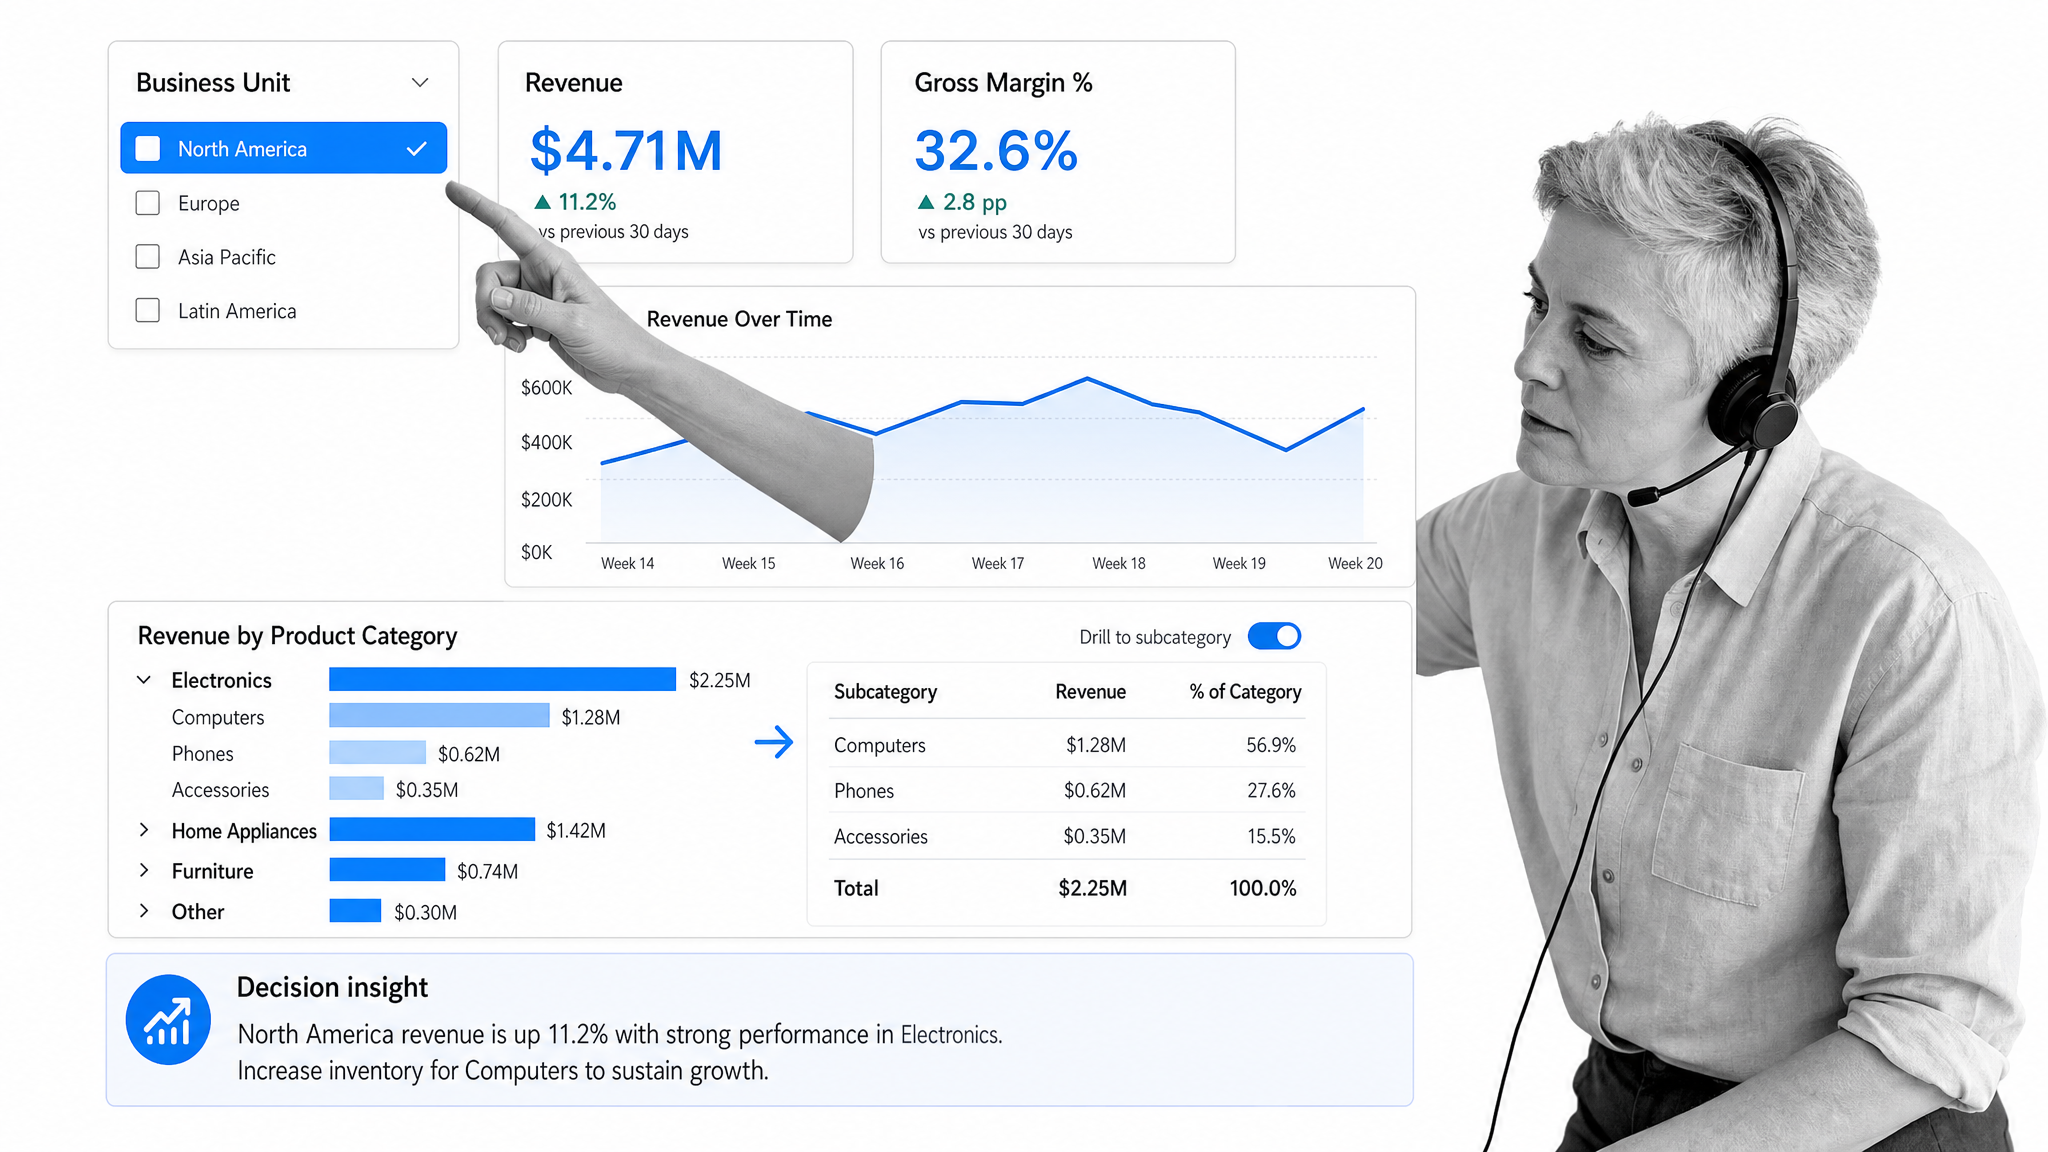
Microsoft Power BI is best for connecting data sources and publishing interactive reports. Analysts can prepare and model data, create reusable measures, and let stakeholders explore a consistent view through filters and drill paths. Microsoft’s Power BI overview describes a platform that connects, visualizes, and shares data across reports and organizational experiences.
Choose Power BI when the business question will recur and the audience needs a governed view rather than a one-time spreadsheet. Agree on definitions before designing the dashboard. A polished visual cannot resolve inconsistent source data or competing interpretations of a metric.
Tableau
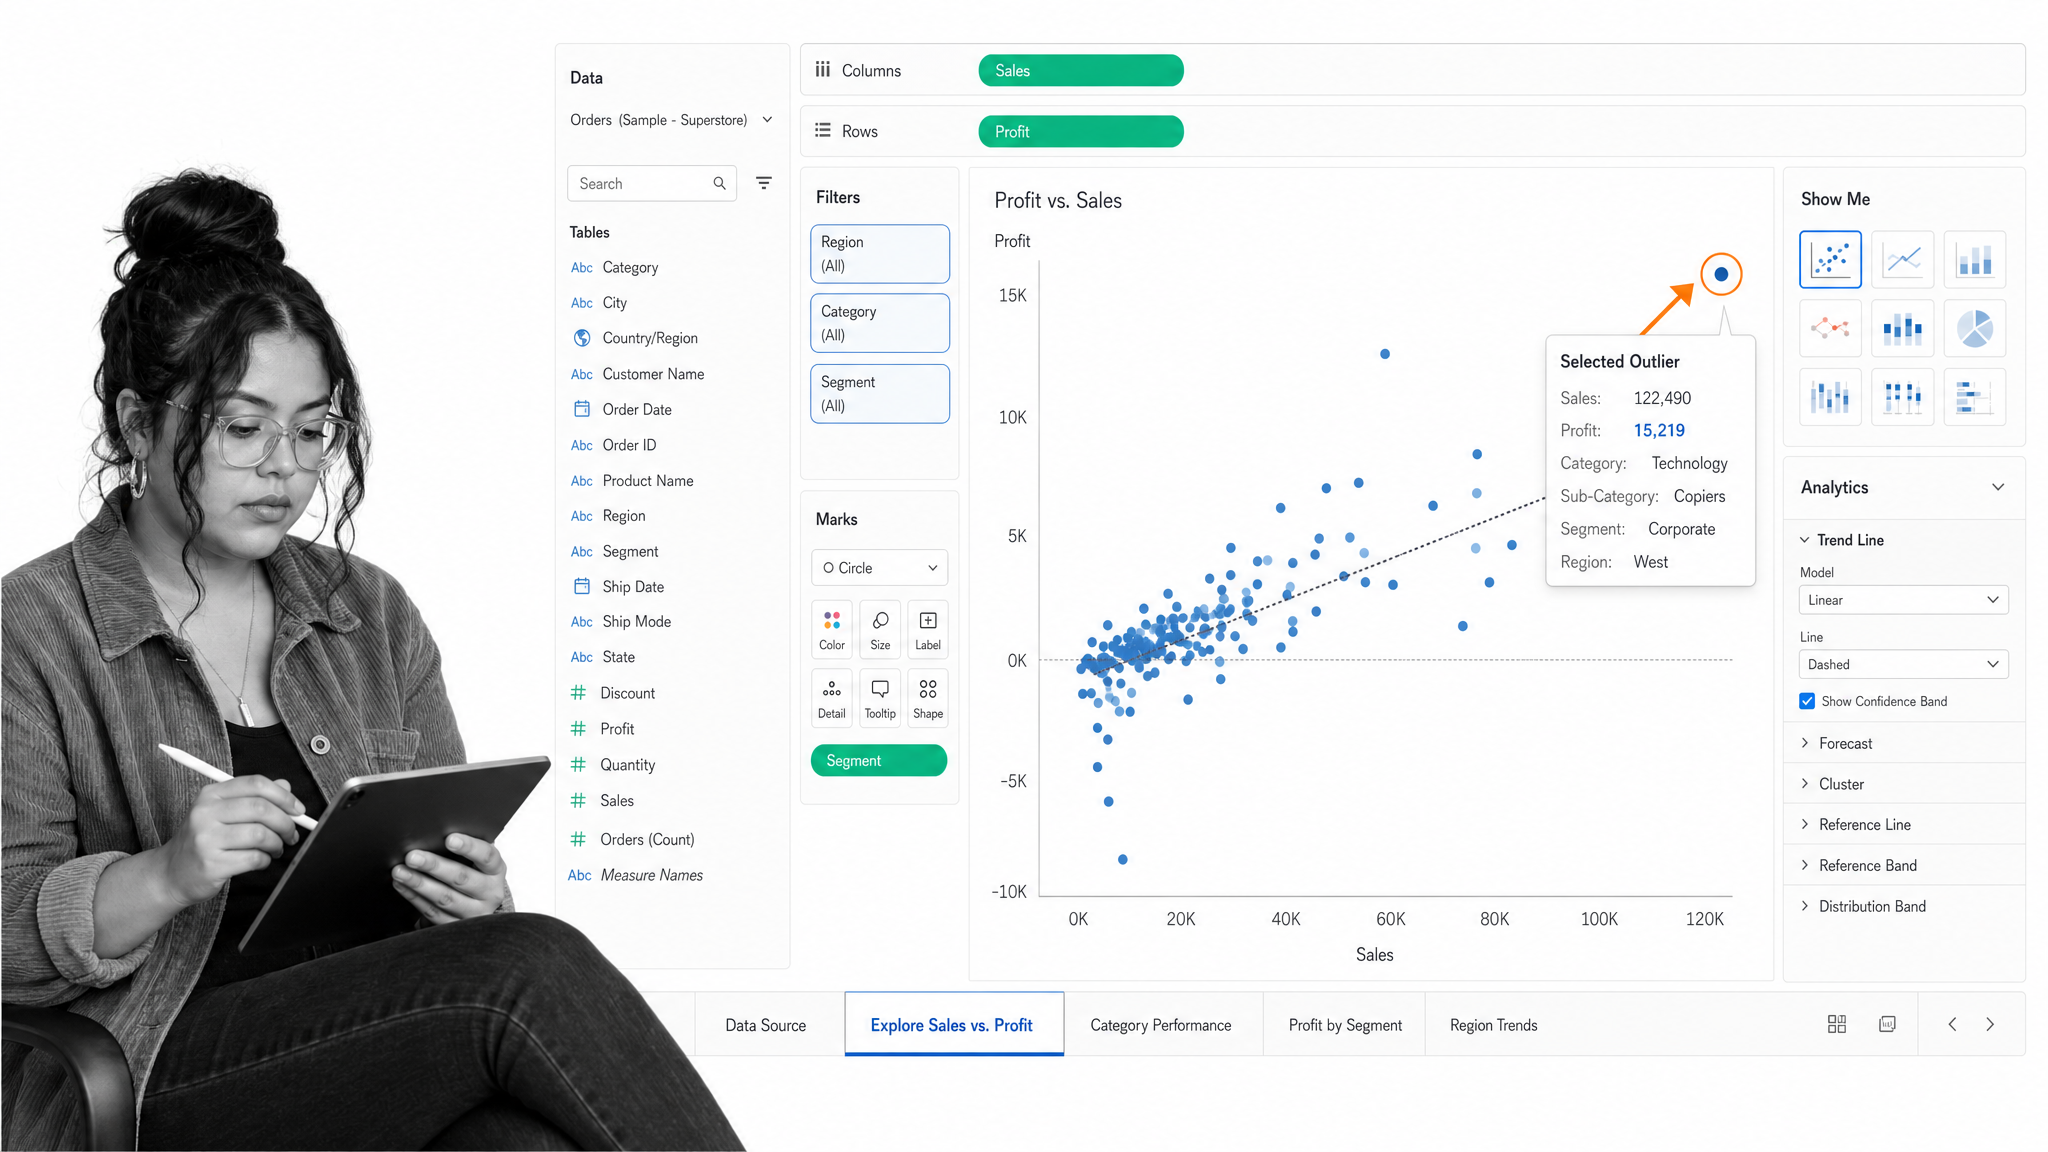
Tableau is best for visual exploration and interactive data storytelling. Analysts can connect to data, combine and manage sources, create calculations, and build views that reveal relationships or unusual behavior. Its visual canvas is useful when the path to an answer is exploratory and stakeholders benefit from seeing the evidence from several angles.
Use Tableau when visual analysis is the center of the work, not merely the final formatting step. Establish the decision the dashboard should support, the level of detail each audience needs, and the action that follows a signal. This keeps the output focused on business change rather than decorative reporting.
Google Looker Studio
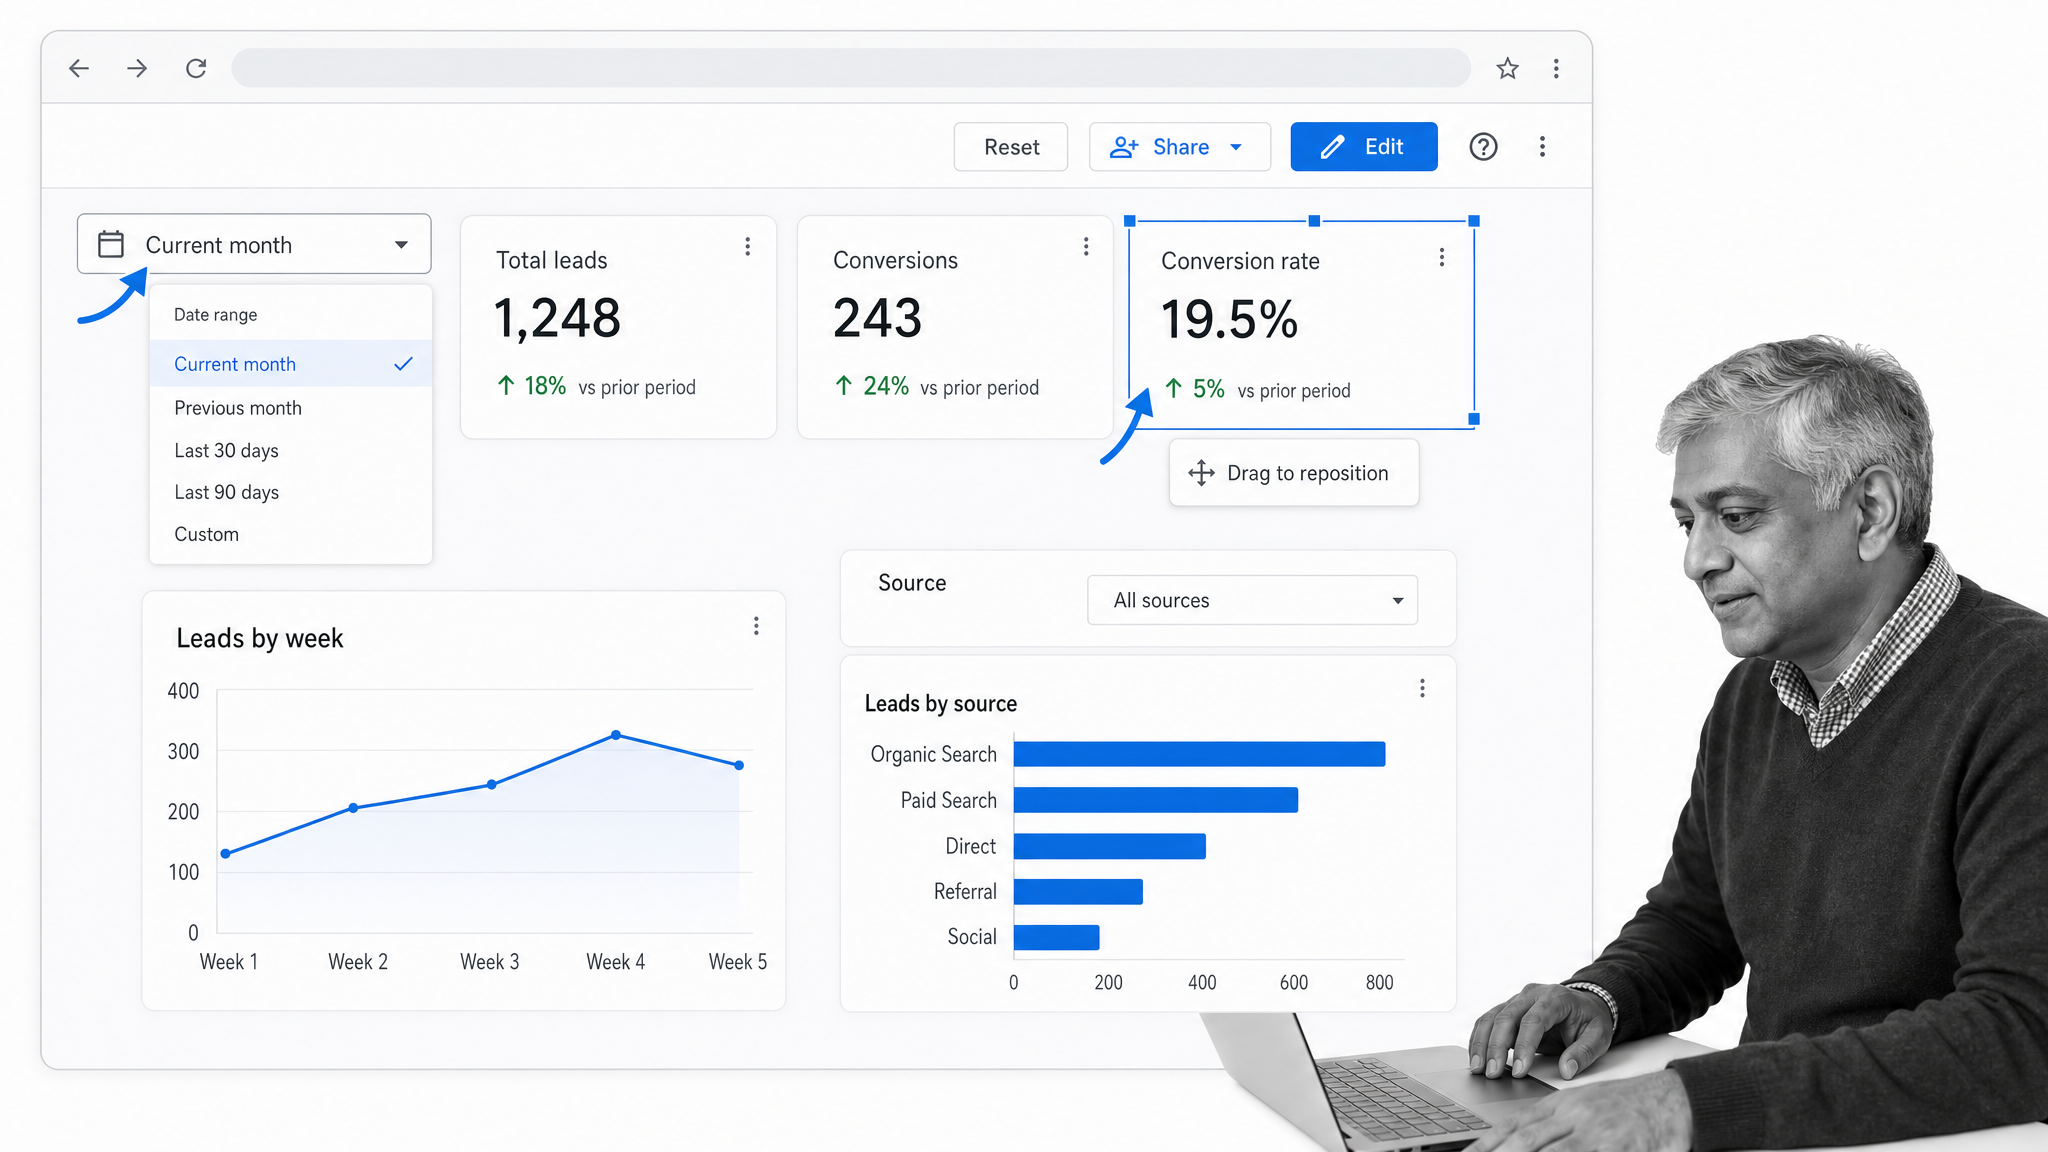
Google Looker Studio is best for accessible, self-service reporting with a drag-and-drop interface. Analysts can connect data, build customizable reports and dashboards, add interactive controls, and share the result with stakeholders. It is a useful choice for straightforward reporting needs and teams that want a low-friction route from source data to a browser-based visual.
Keep the data model and metric definitions simple. If the analysis requires advanced governance, complex semantic logic, or tightly managed deployment, evaluate whether a broader BI platform is a better fit. For lightweight stakeholder communication, Looker Studio can make recurring evidence easier to consume.
Jira
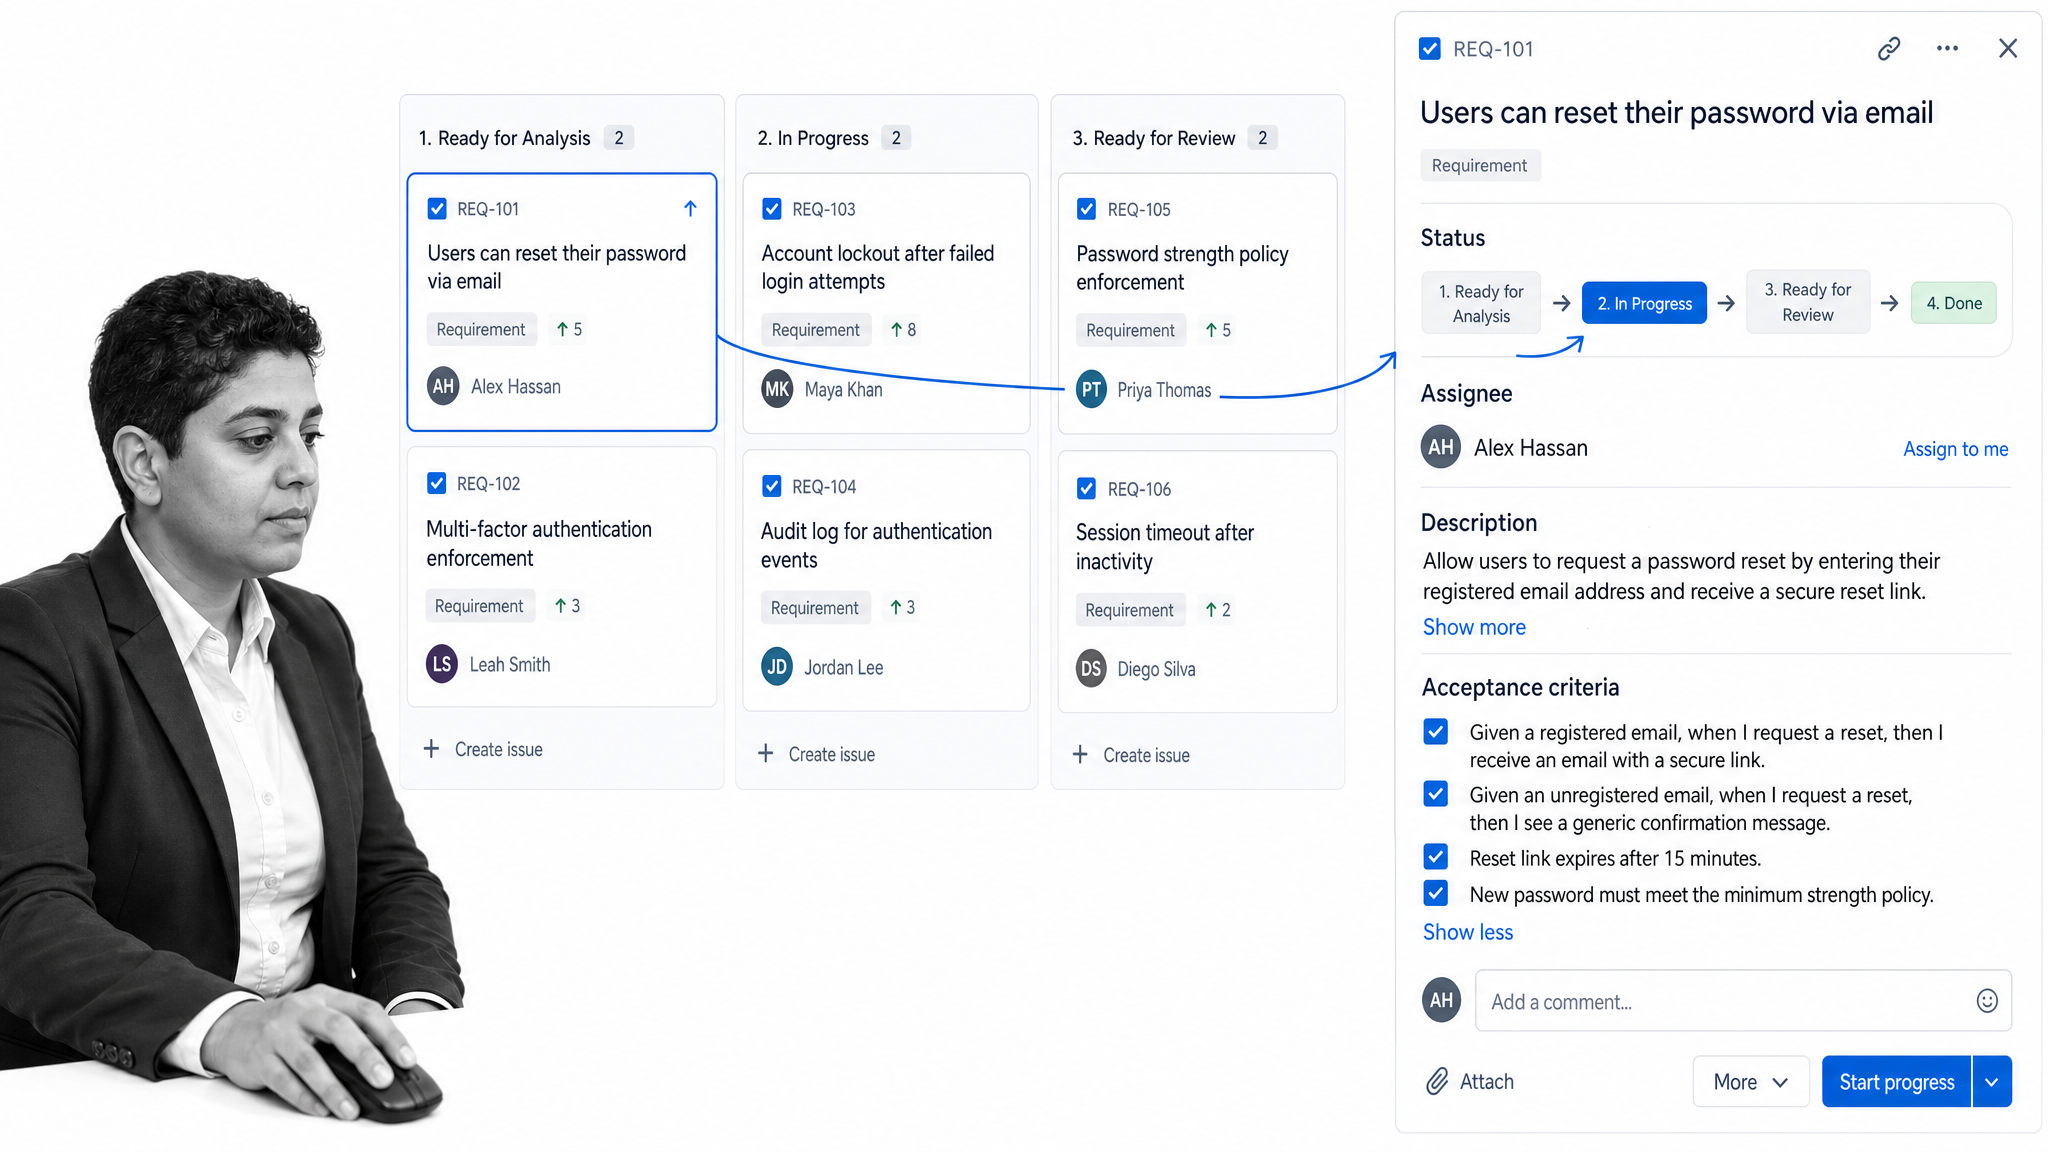
Jira is best for tracking work from a defined requirement through delivery. Its planning and workflow features include forms, customizable workflows, and views such as boards, lists, timelines, and calendars. Business analysts can use those structures to clarify acceptance conditions, manage dependencies, and follow work across states.
Jira is most effective when issue types, fields, and statuses reflect real decisions. Too many required fields create administrative drag, while vague tickets push context into side conversations. Define a lean information model and connect the delivery record to the approved requirement or process source.
Confluence
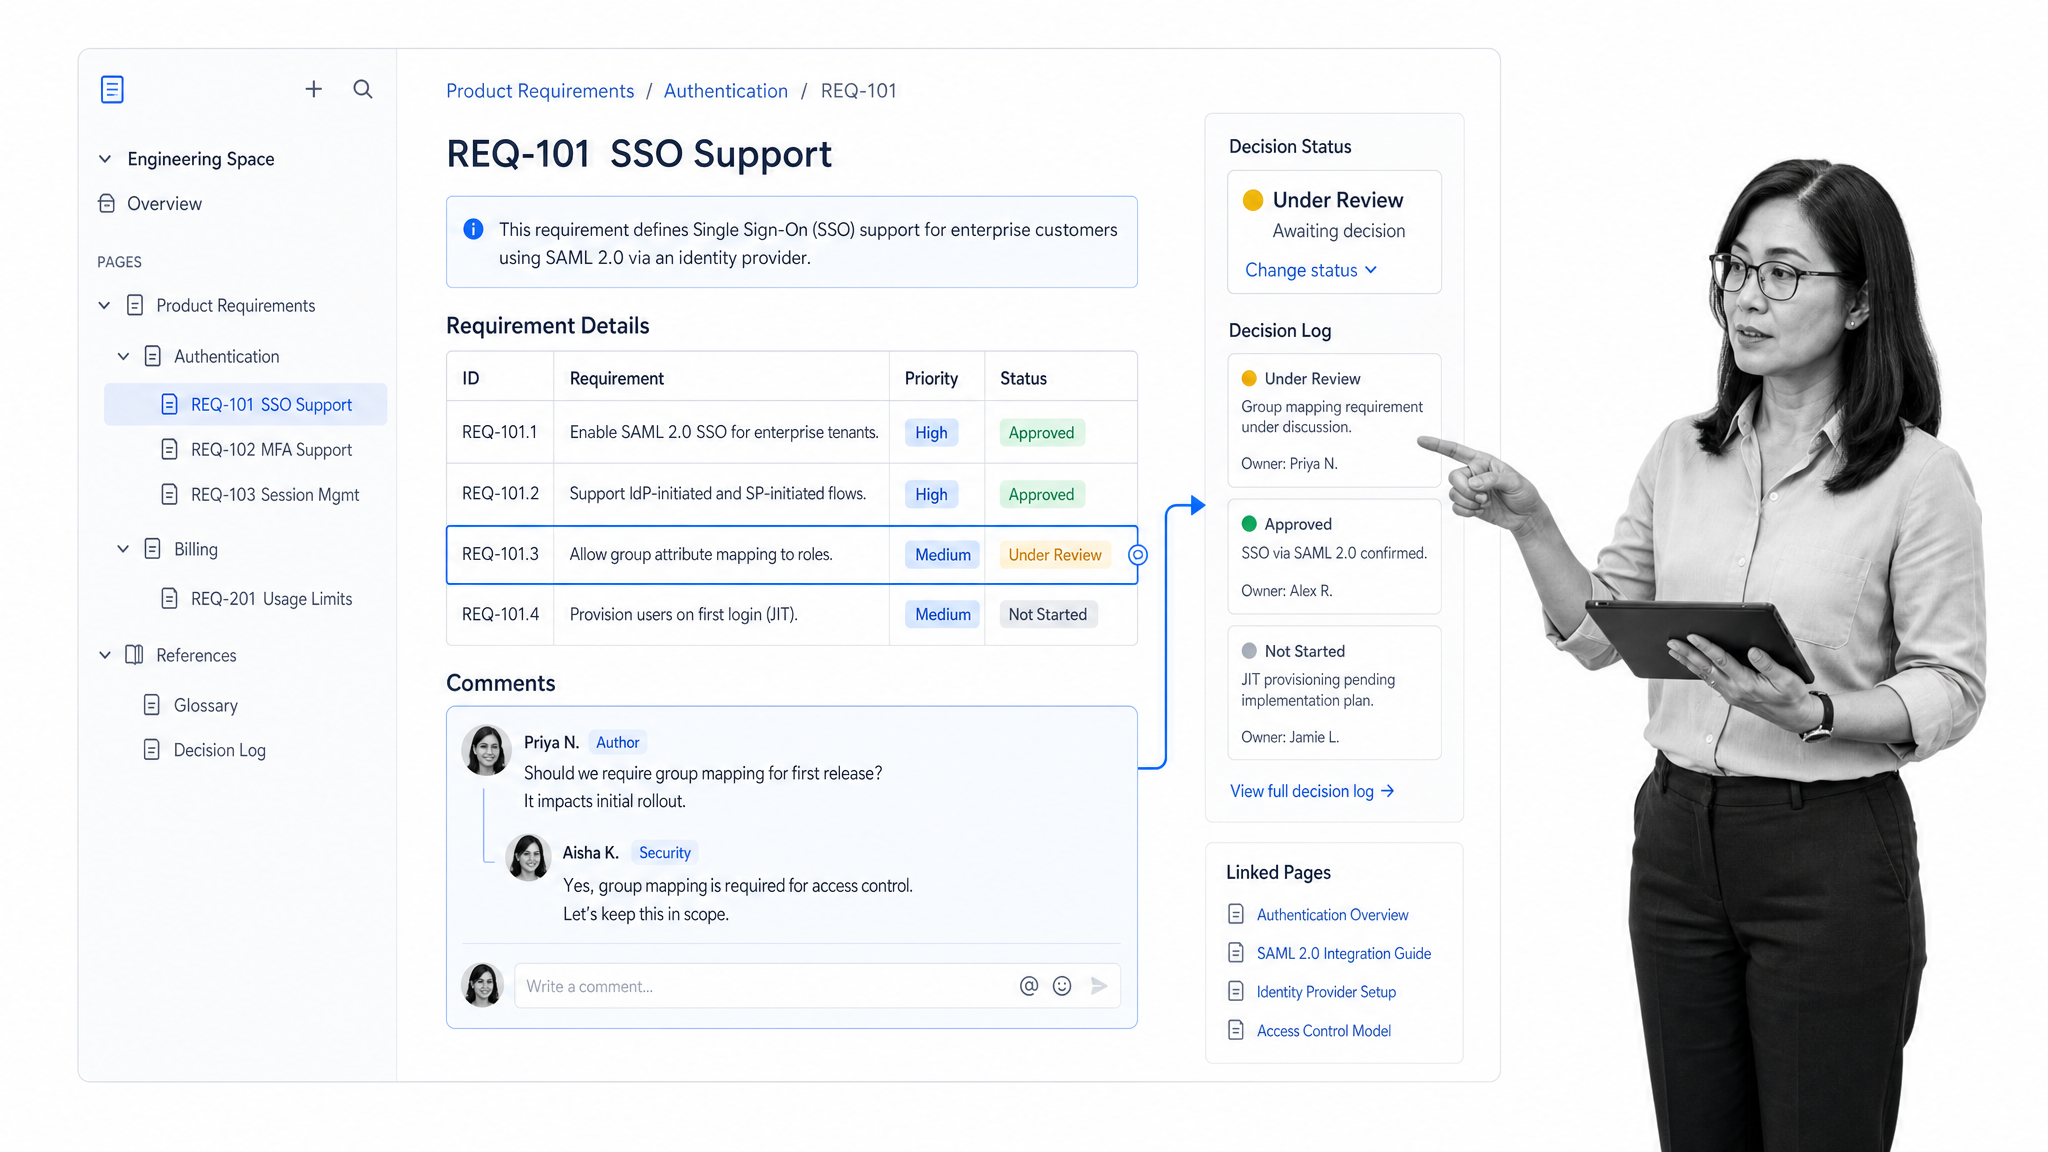
Confluence is best for collaborative documentation that evolves through discovery. Pages and live documents support structured narratives, while whiteboards and databases give teams additional ways to organize ideas, decisions, and project information. Analysts can centralize interview notes, requirement context, decision logs, and supporting evidence in a shared workspace.
Good information architecture is essential. Use consistent page templates, name an owner, separate approved content from working notes, and make decision status visible. Confluence can preserve the reasoning around a requirement, but execution still benefits from a system that assigns and tracks the operational steps.
Lucidchart
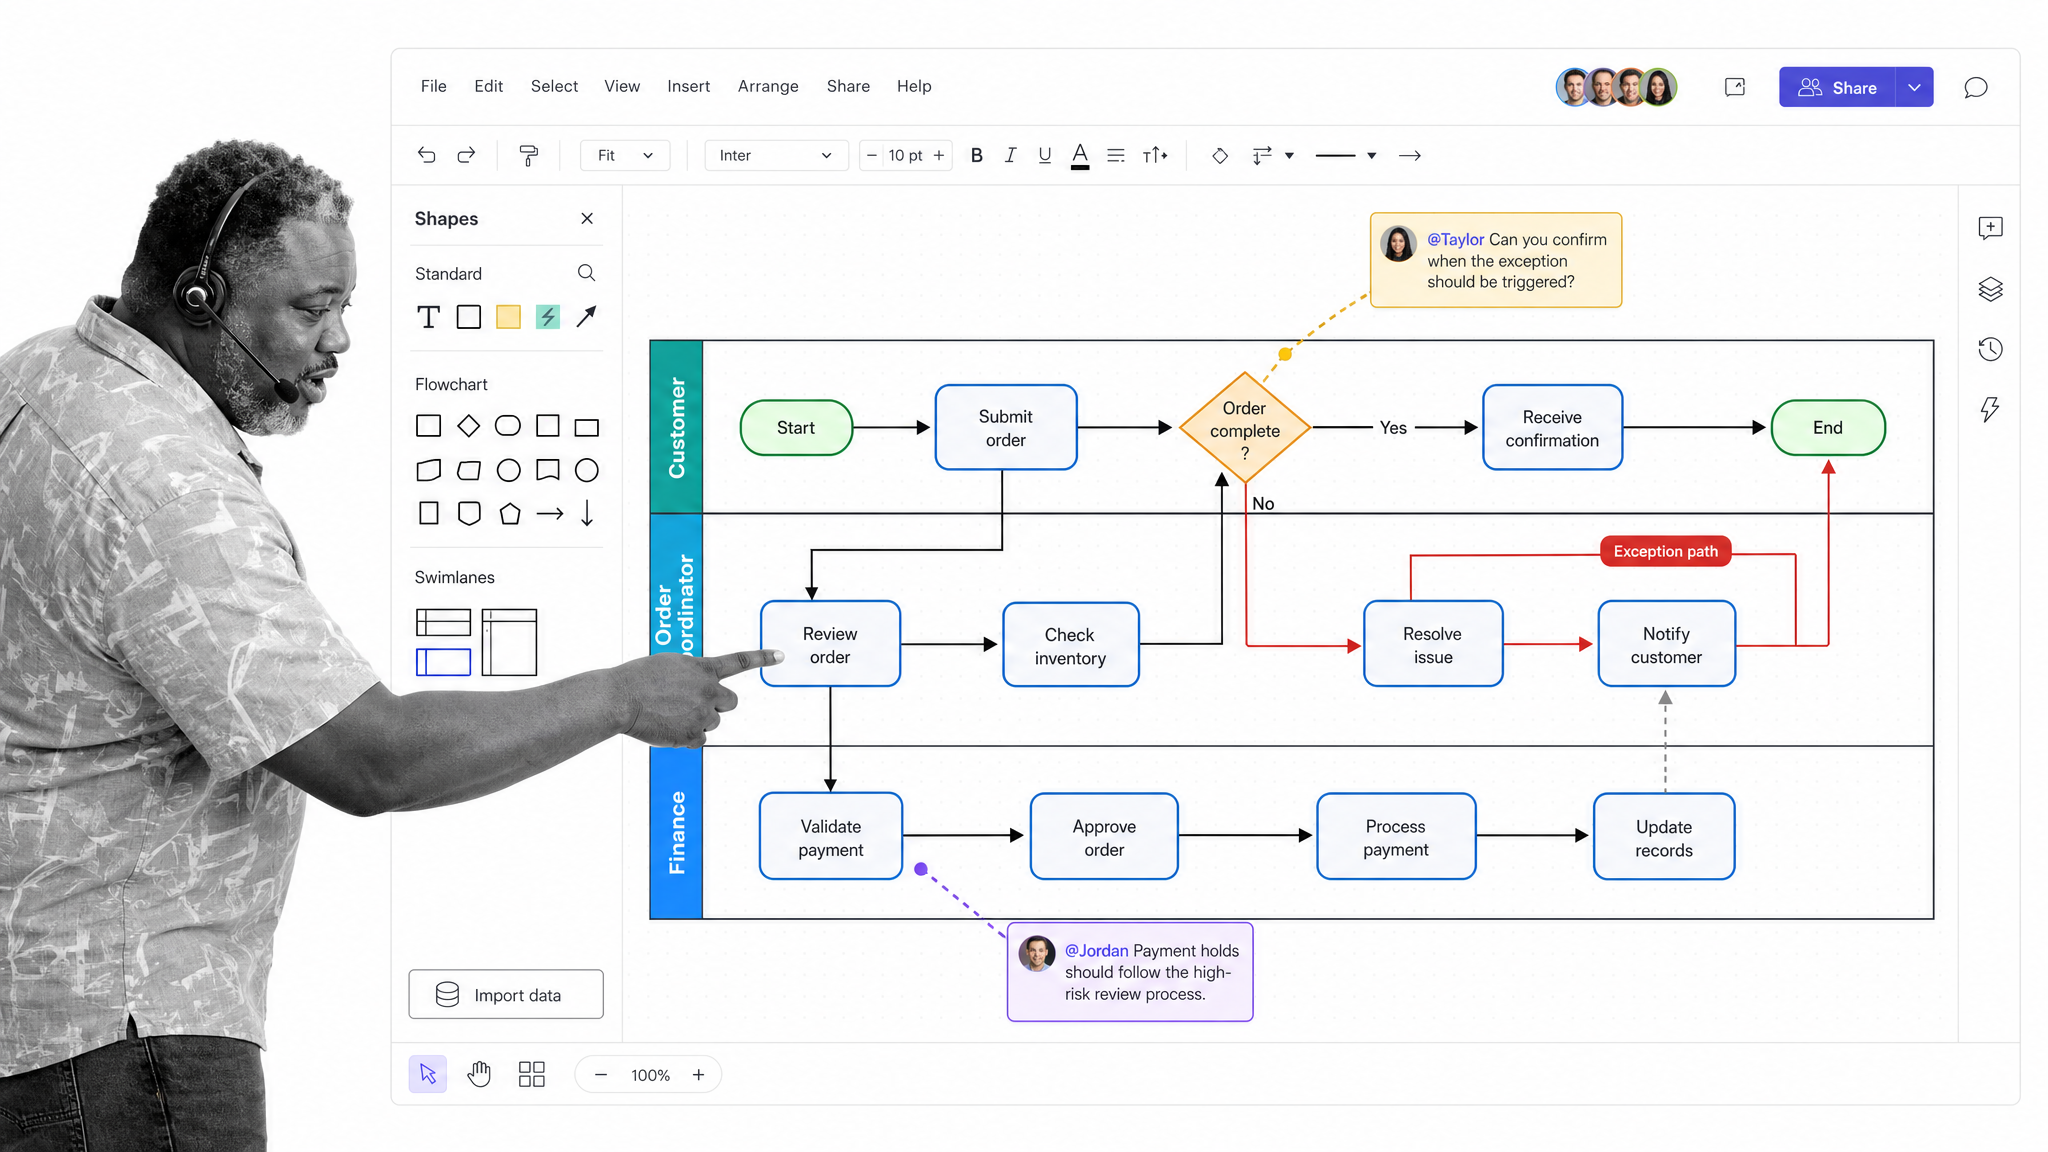
Lucidchart is best for collaborative process maps and system diagrams. Its process mapping workspace supports drag-and-drop diagramming, templates, collaboration, and importing information to accelerate a first draft. Analysts can use it to show activities, decisions, owners, handoffs, and exception paths before the team commits to a solution.
A useful map has a defined scope and level of detail. Begin with the trigger and end state, then add the decisions and handoffs that affect performance or control. Once the target design is approved, translate it into a managed process rather than relying on the diagram as an execution system.
Miro
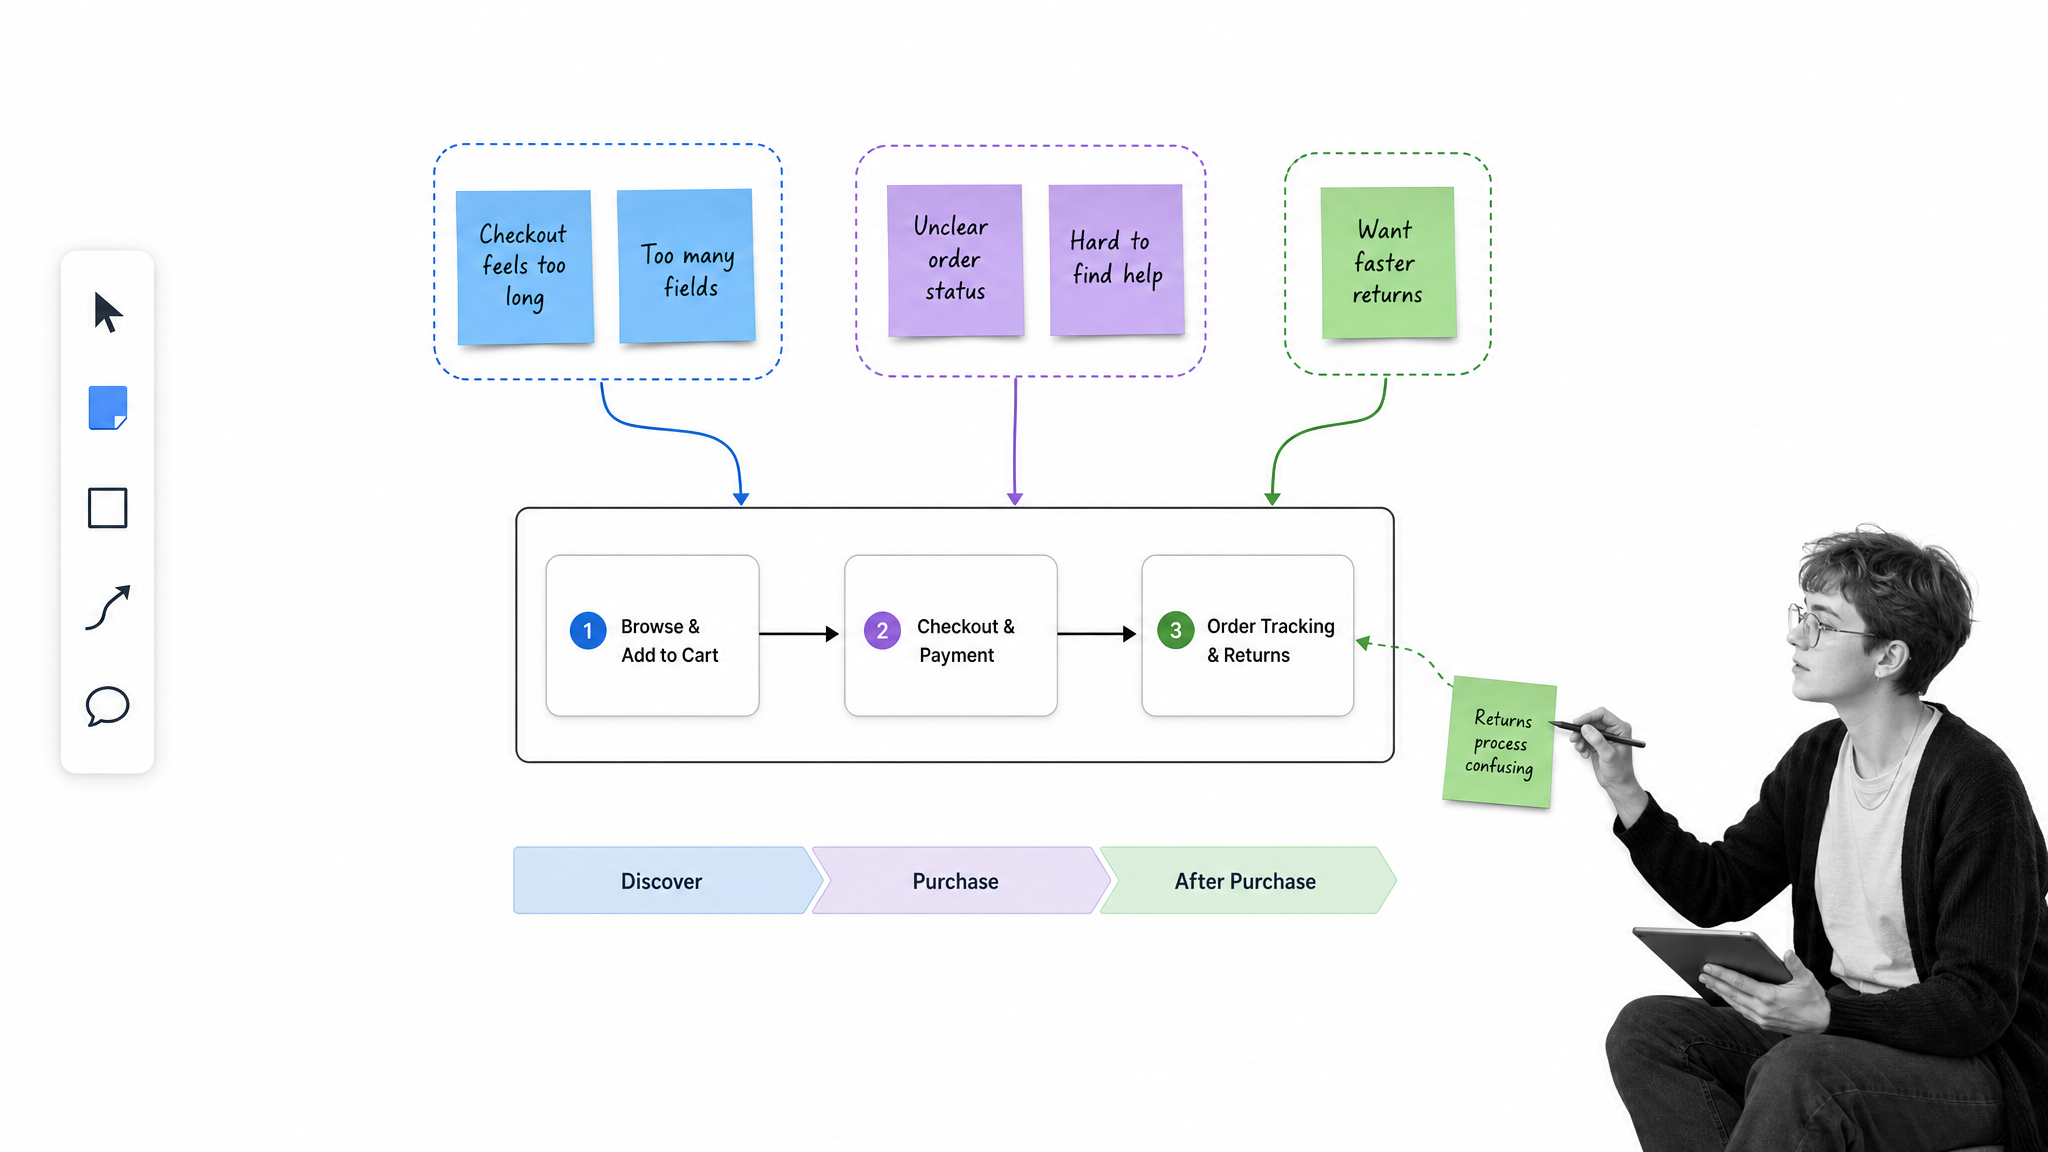
Miro is best for live discovery workshops that combine visual thinking with diagramming. Teams can collaborate on an open canvas, build flowcharts, use process-modeling shapes, organize layered diagrams, and connect process views with user stories or other workshop artifacts. This makes it useful for interviews, journey mapping, root-cause sessions, and early solution design.
The open canvas needs facilitation. Set a clear question, prepare the working area, define how decisions will be marked, and move accepted outputs into their durable system of record. Otherwise, an energetic workshop can leave behind an attractive board with unclear ownership.
Balsamiq
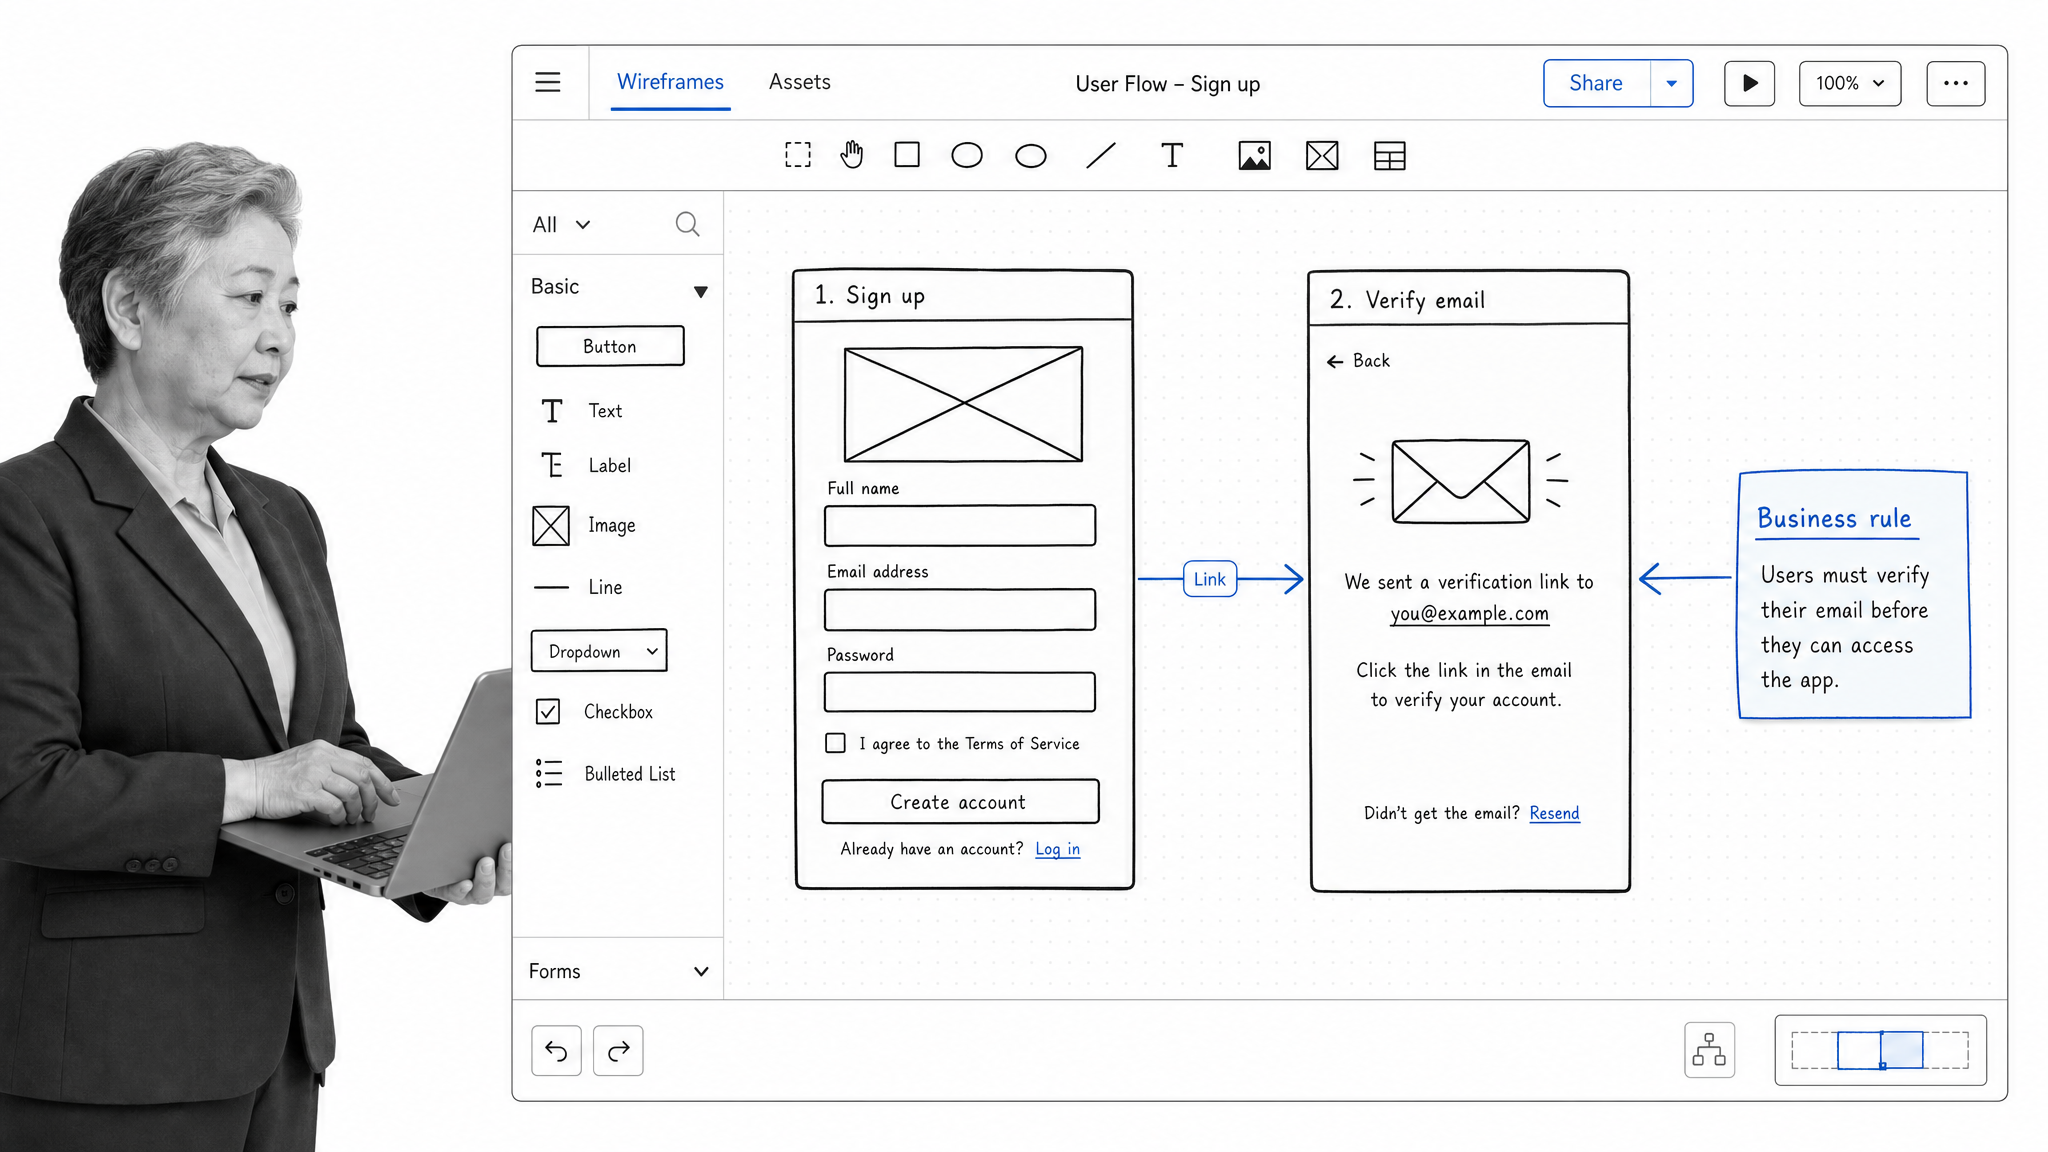
Balsamiq is best for low-fidelity wireframes that keep feedback focused on structure and behavior. Analysts can assemble interface controls, link wireframes into flows, and create a concrete representation of a proposed experience without implying that the visual design is finished. The intentionally simple style helps stakeholders discuss fields, states, navigation, and business rules.
Use a wireframe to test assumptions early. Annotate the business rule behind an element, include important error and empty states, and connect each screen to the requirement it helps satisfy. A clear low-fidelity prototype can expose misunderstanding before development makes a change expensive.
Microsoft Visio
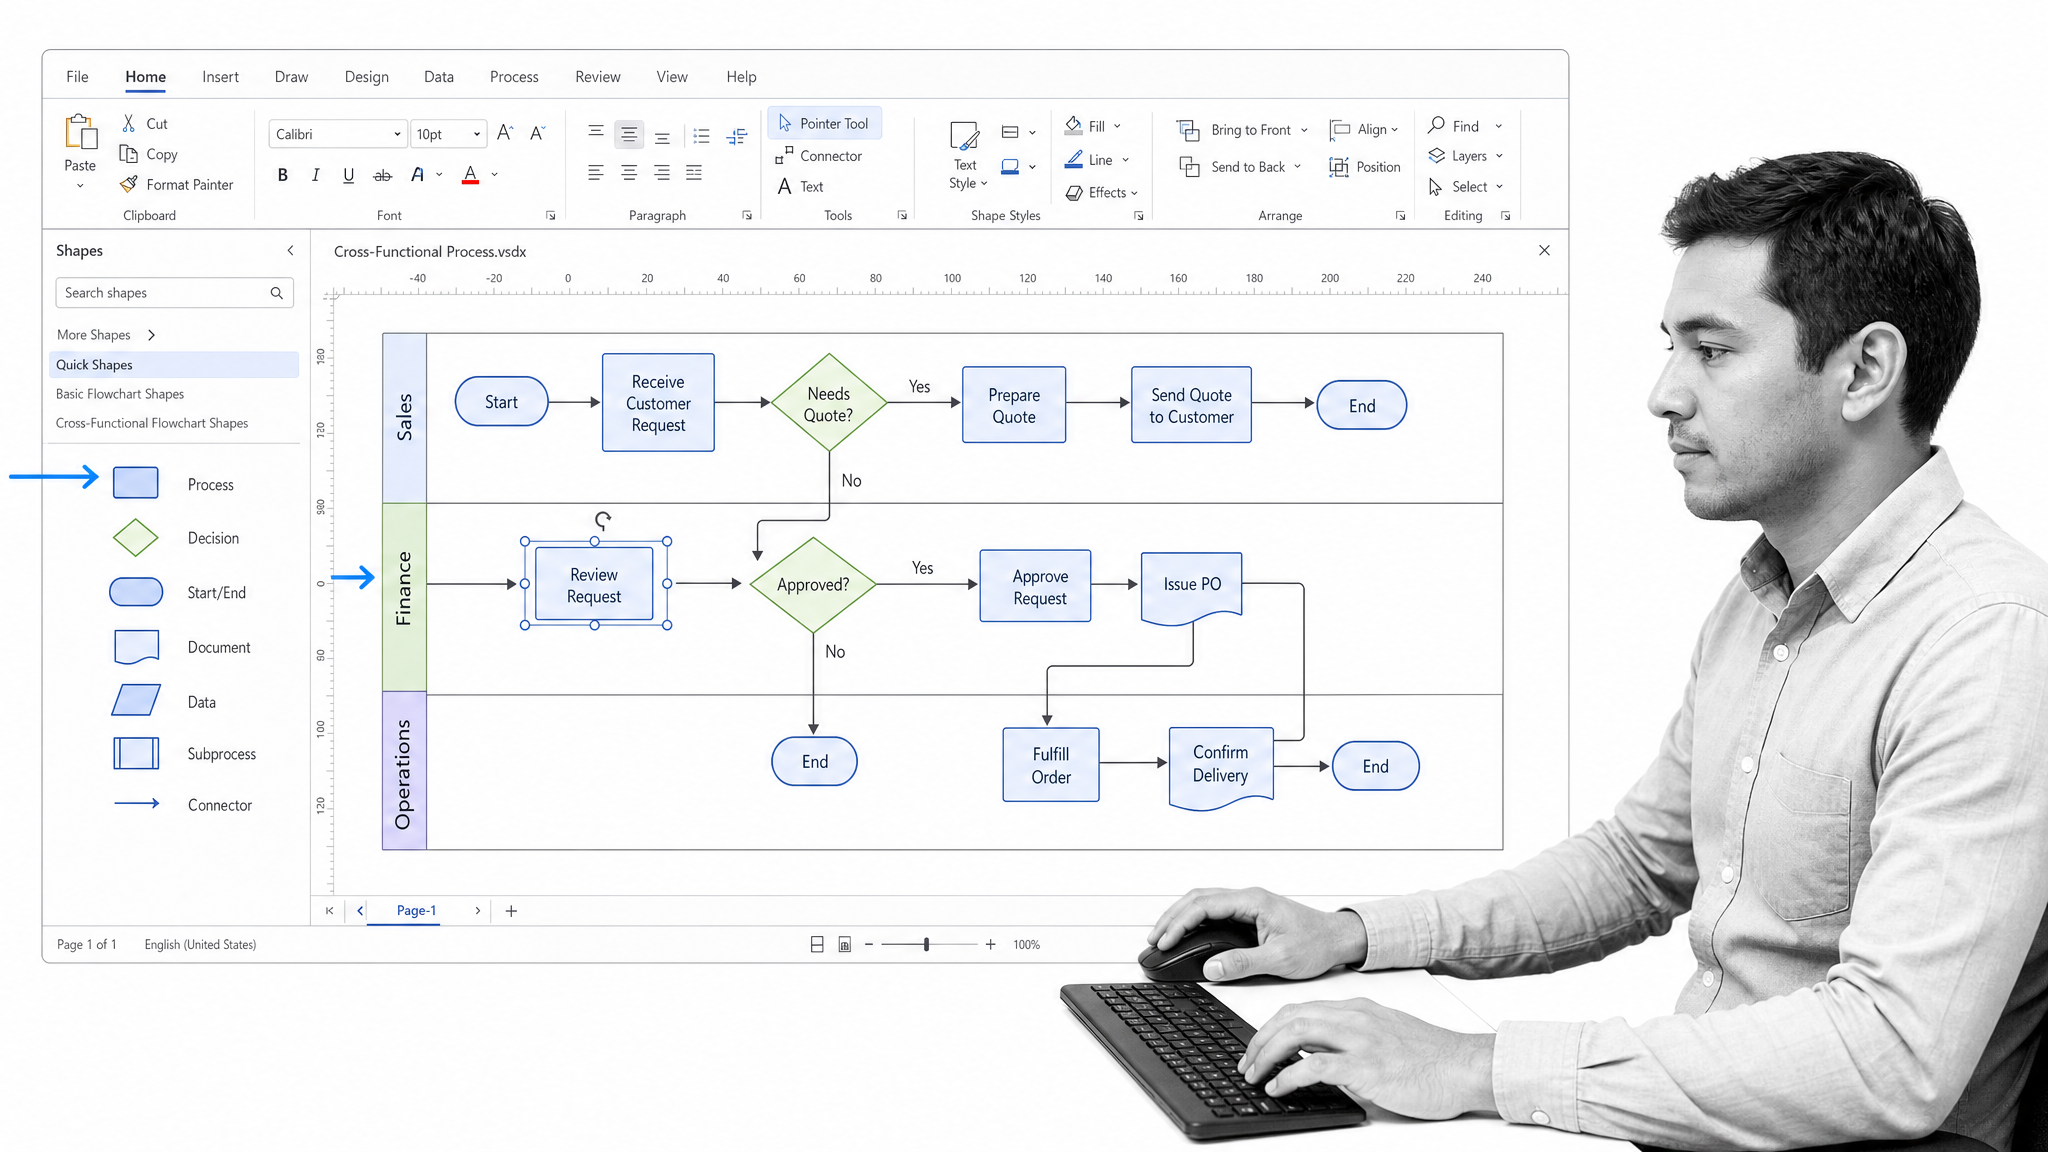
Microsoft Visio is best for formal process diagrams in organizations that prefer Microsoft tooling. It supports basic flowcharts, cross-functional flowcharts with swimlanes, and diagrams aligned to process methodologies. Business analysts can use those formats to clarify sequence, role boundaries, decision points, and departmental handoffs.
Visio is a practical option when stakeholders need familiar diagram files or a defined notation. Establish modeling conventions before several analysts begin contributing. Consistent symbols, naming, and detail levels make diagrams easier to compare and maintain.
Jama Connect
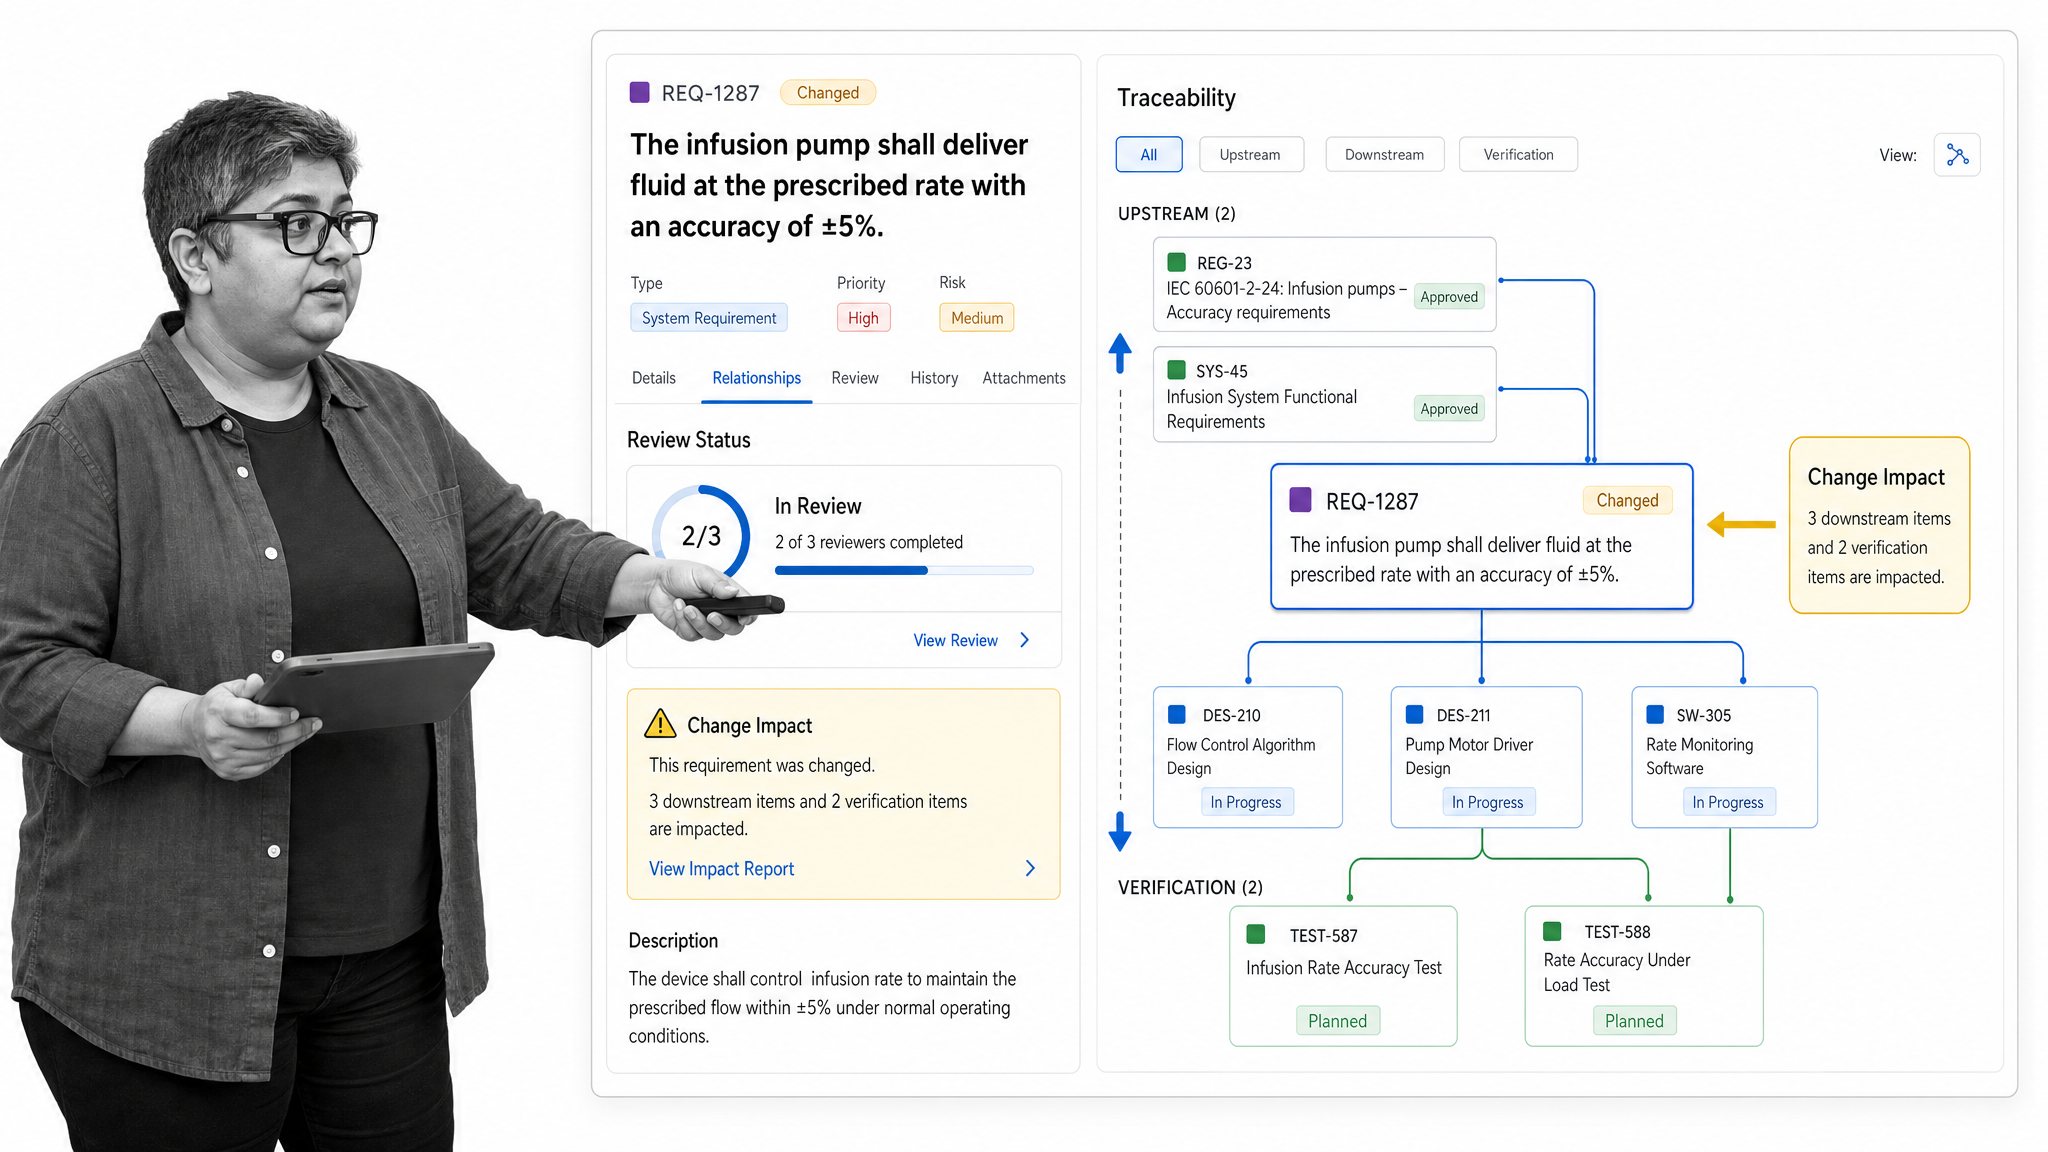
Jama Connect is best for requirements work where traceability, review, and change impact are central. It supports requirements authoring, structured relationships, review workflows, tests connected to requirements, and analysis of downstream effects. That makes it relevant for complex products and regulated environments in which teams must show why a requirement exists and what a change affects.
Dedicated requirements software adds value when a document or ticket cannot express the needed relationship model. Define item types and traceability rules around real assurance needs. Excessive structure can burden contributors, so capture only what the team will use to make, verify, or defend a decision.
Modern Requirements4DevOps
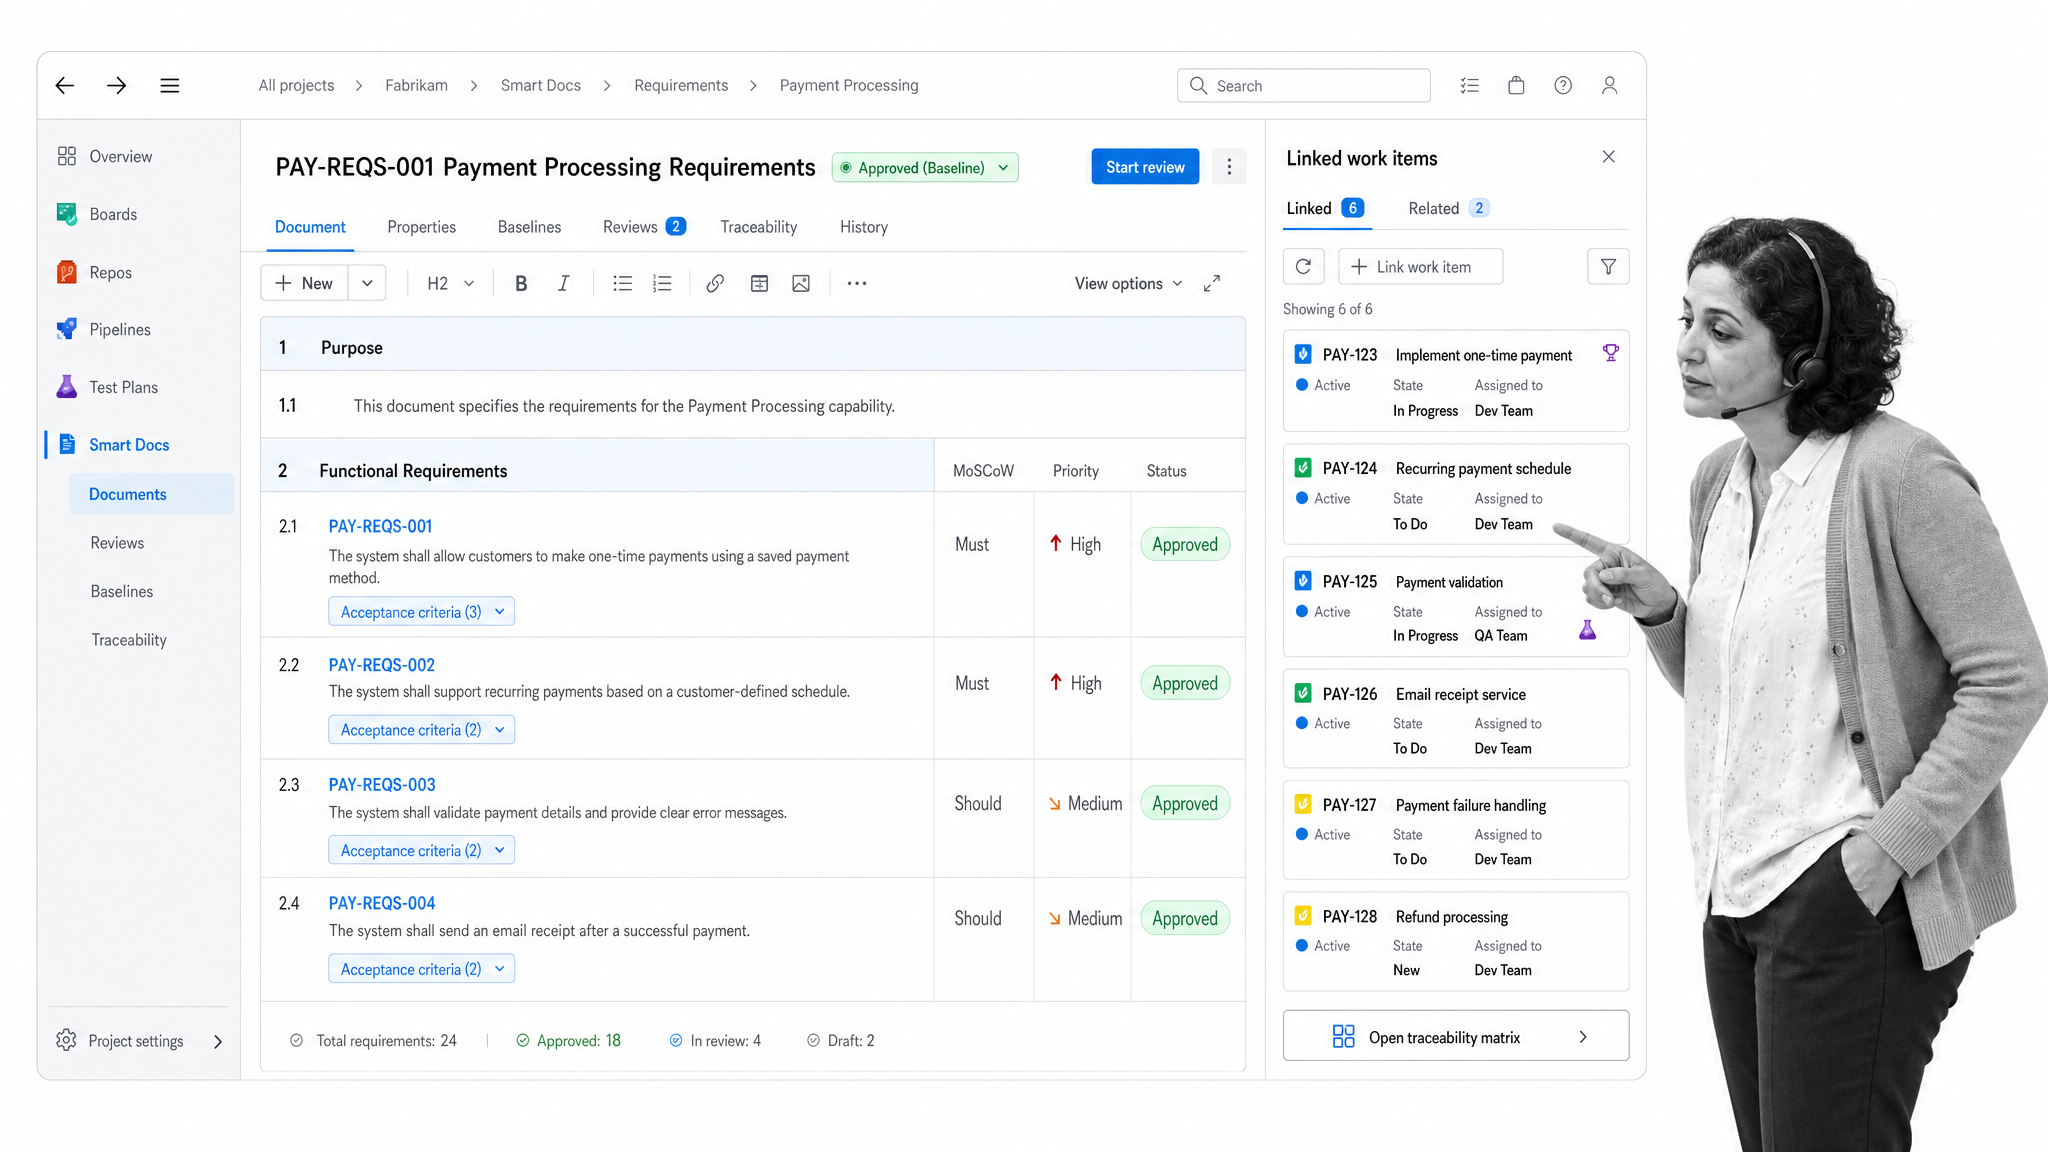
Modern Requirements4DevOps is best for teams that manage requirements inside Azure DevOps. The product is built natively into that environment and adds structured authoring, reviews, traceability views, and baselines around the work items used for delivery. Analysts can keep requirements and development context close while giving stakeholders purpose-built ways to review and understand change.
Choose it when Azure DevOps is the established delivery system and reducing tool switching is important. Set a clear boundary between a business requirement, a delivery item, and an acceptance test. That distinction keeps the chain understandable as the solution changes.
Bizagi Modeler
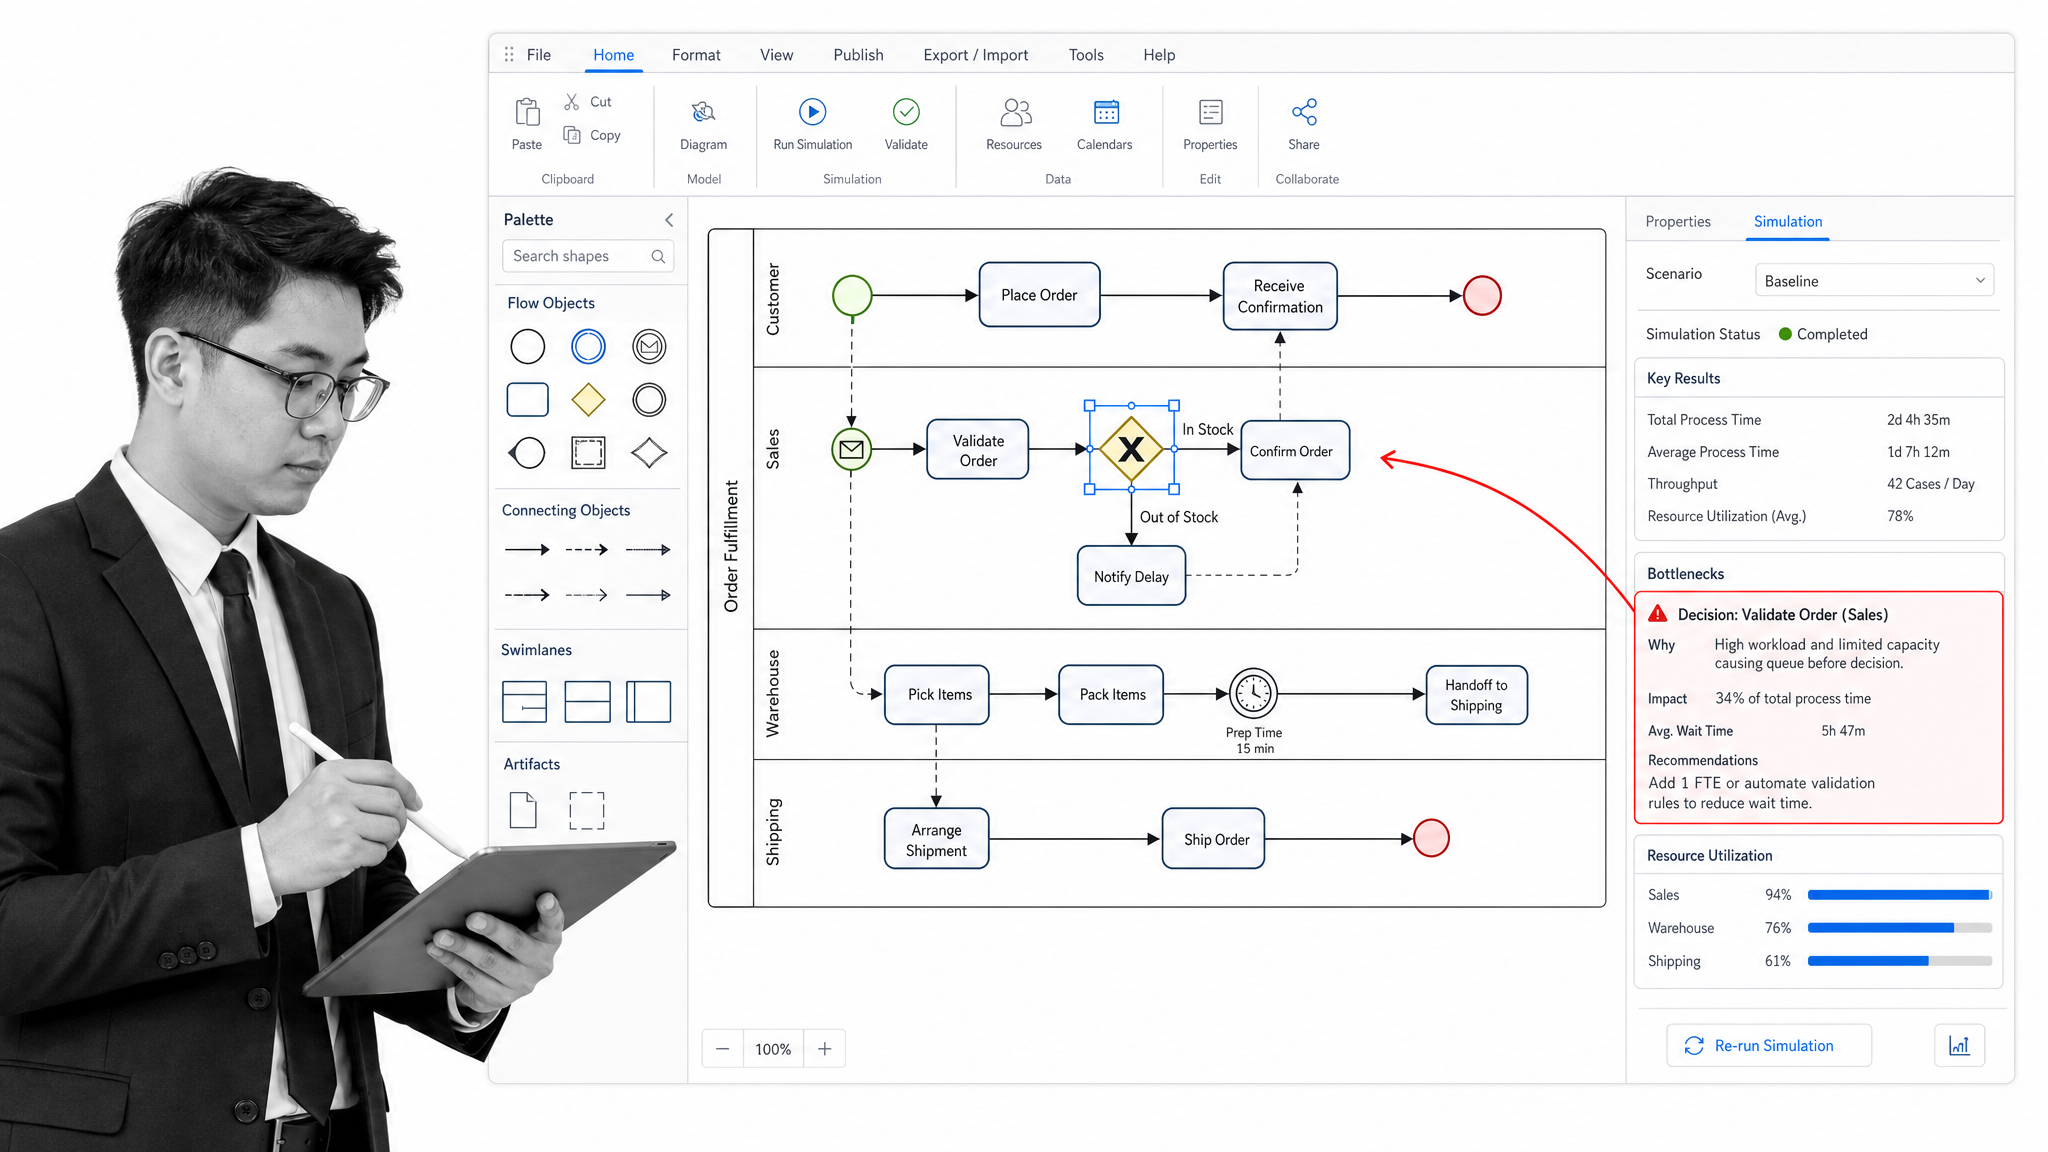
Bizagi Modeler is best for business process modeling with structured notation. Analysts can map processes, run simulations, publish models, and collaborate around process documentation. Support for BPMN helps teams express events, activities, gateways, roles, and message flows with a shared visual language.
Use simulation when timing, resources, or volume assumptions could change the recommended design. A model can help identify bottlenecks before implementation, but its assumptions need to be documented and tested against operational evidence. Pair the accepted design with continuous improvement so real performance informs later changes.
Smartsheet
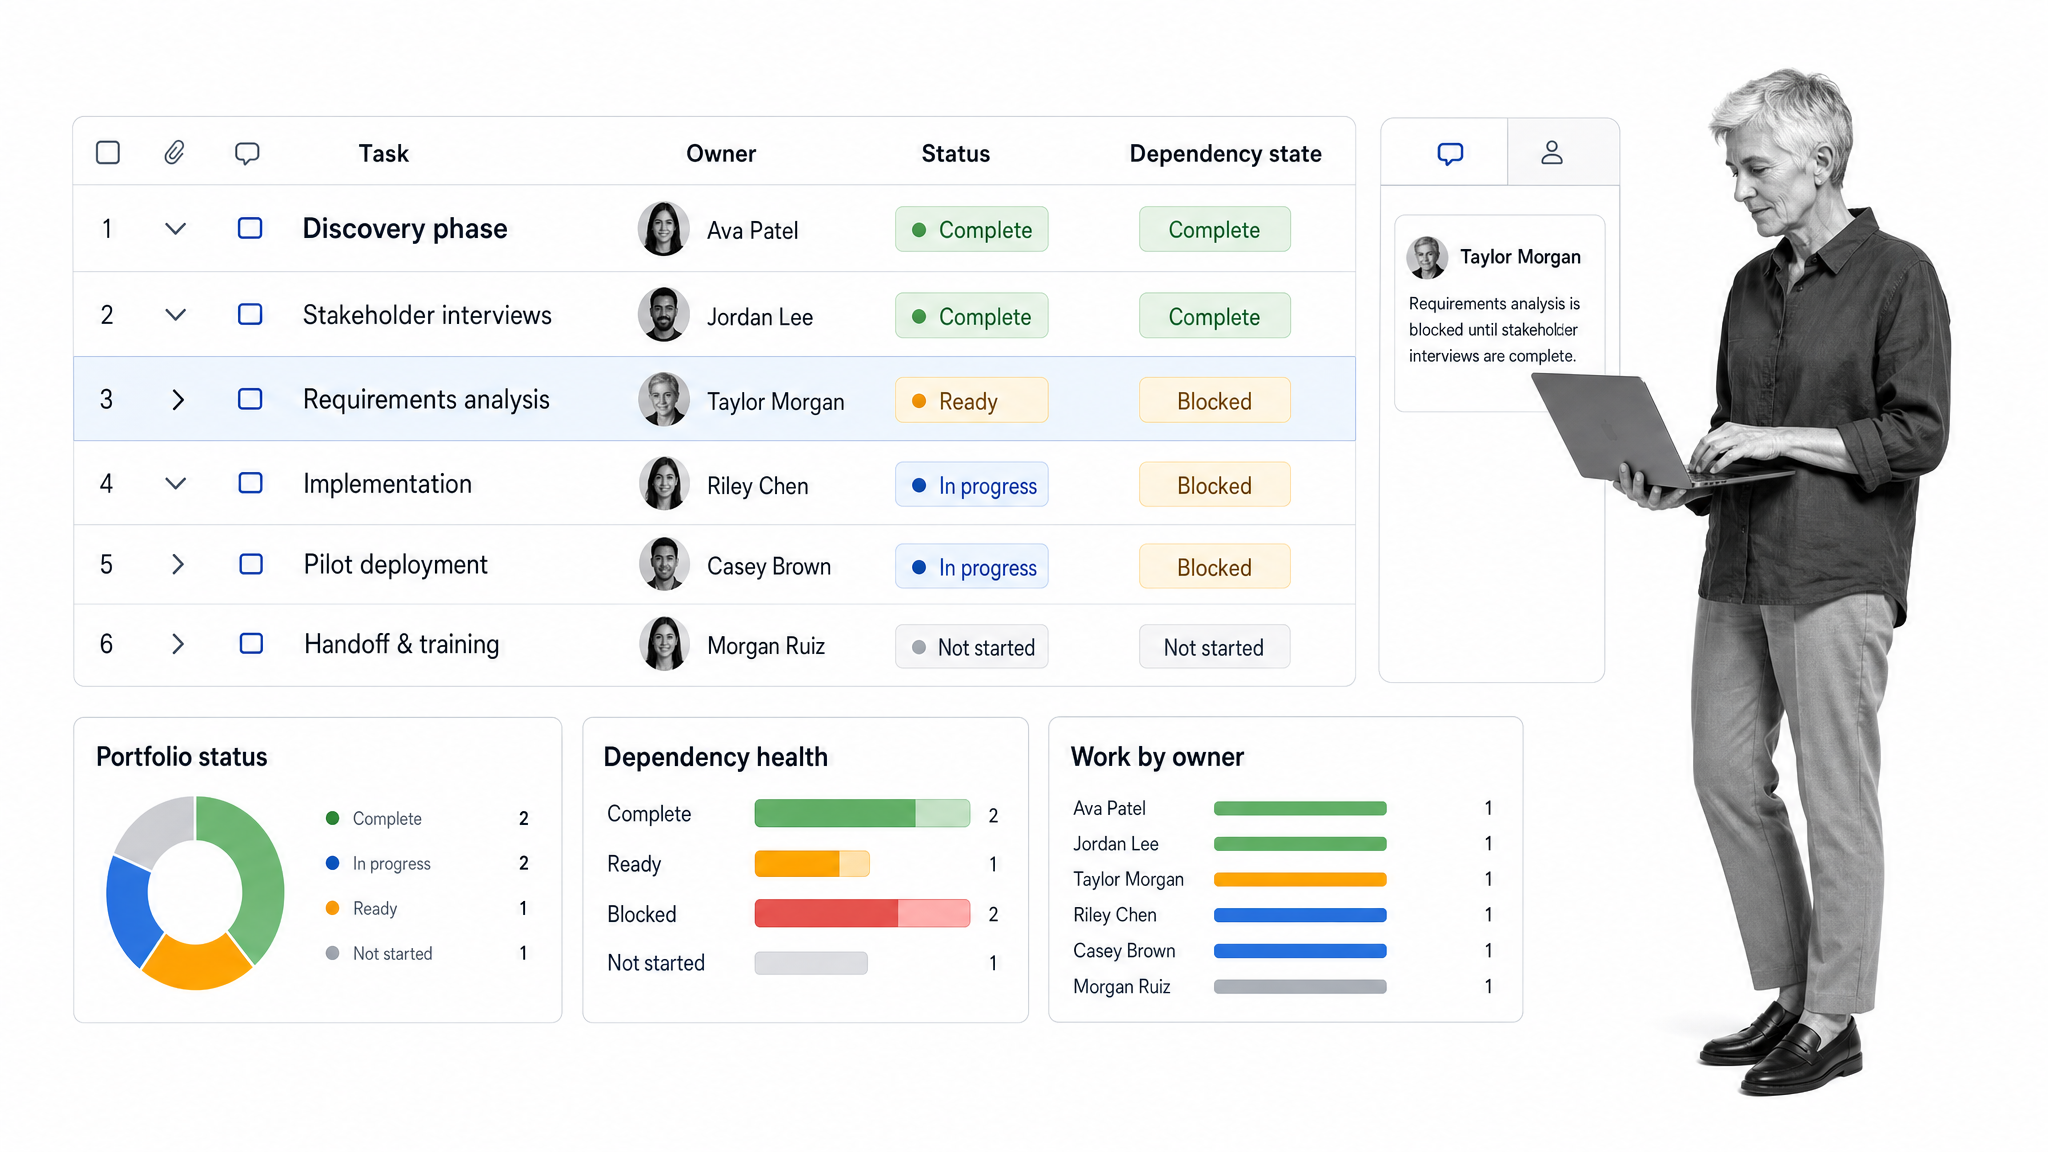
Smartsheet is best for collaborative planning that benefits from a spreadsheet-like grid. It offers multiple work views, reports, dashboards, forms, and workflow automation. Business analysts can organize discovery tasks, collect structured input, monitor dependencies, and summarize progress for stakeholders who want familiar project visibility.
Choose Smartsheet when the central problem is coordinating a portfolio of work rather than executing a tightly controlled operational procedure. Design the sheets around stable entities and ownership, then use reports and dashboards to answer defined management questions. Avoid copying the same requirement or status into several grids.
How should you choose business analyst tools?
Selection should begin with a real analysis and change workflow, not a generic feature matrix. Follow the work from stakeholder request through evidence, approval, implementation, and ongoing control. The gaps along that path reveal which capabilities matter.
- Define the job and artifact. Decide whether the immediate output is a calculation, dashboard, requirement set, process map, wireframe, plan, or executable workflow.
- Name the system of record. Each requirement, decision, model, and operational process needs one authoritative home.
- Test the handoffs. Check how evidence moves into decisions and how approved decisions become assigned work. Manual copying is a source of delay and inconsistency.
- Evaluate governance. Consider permissions, approvals, version control, traceability, retention, and the evidence required for internal or external review.
- Design for contributors. Stakeholders need a clear way to supply information and review outputs without learning every specialist tool.
- Pilot an end-to-end case. Use a representative workflow with real exceptions and decision points. Measure time, rework, missing information, and adoption.
The result should be a small, intentional stack. Specialist tools can produce strong analysis, while Process Street provides the controlled execution layer that keeps the approved process moving. Review the stack periodically and remove duplicate surfaces that do not improve a decision or handoff.
Can one platform replace every business analyst tool?
Usually not. Spreadsheet modeling, process notation, requirements traceability, and operational workflow execution are distinct jobs. Forcing every activity into one surface can weaken the specialist work and make the operating model harder to understand.
A better design uses a hub-and-spoke pattern. Focused analysis tools create evidence and models. The approved result then connects to a controlled workflow that assigns responsibility, captures operational data, manages approvals, and records completion. This approach preserves specialist depth while giving the business a reliable place to run the process.
Start by mapping the handoff from insight to action. If teams routinely lose decisions in documents, repeat data entry, or chase owners through chat, improving that handoff may deliver more value than buying another analysis surface. A business process analysis can reveal where the stack needs connection, control, or simplification.
What do teams ask about business analyst tools?
What tools do business analysts use most often?
Common categories include spreadsheets, BI platforms, diagramming tools, requirements systems, collaborative documentation, planning software, and workflow platforms. The right mix depends on whether the analyst is exploring data, defining a solution, or operationalizing a process.
Is Excel enough for a business analyst?
Excel can handle many discovery and calculation tasks, but it does not cover every need. Analysts may also need diagramming, formal requirements traceability, collaborative planning, BI publishing, or controlled workflow execution.
Which tool is best for requirements management?
The best fit depends on the required traceability and delivery environment. Jama Connect suits complex requirements relationships and review, while Modern Requirements4DevOps suits teams centered on Azure DevOps. Process Street is the stronger choice when approved requirements must become a controlled operational workflow.
What is the best tool for process mapping?
Lucidchart and Visio suit general process diagrams, Miro supports collaborative workshops, and Bizagi Modeler supports structured process modeling. When the map is approved, Process Street can turn it into an assigned, trackable workflow.
Do business analysts need coding tools?
Not for every role. Analytical thinking, process knowledge, data literacy, and stakeholder communication are more broadly useful. Technical analysts may use query languages or development tools when the work requires direct access to data or close collaboration with engineering.
How should a team build its business analyst tool stack?
Begin with a representative change from request to execution. Assign one system of record to each artifact, connect the critical handoffs, test governance, and remove duplicate tools. Keep the stack focused on decisions and reliable execution.