 Workflows
 Forms
Forms Data Sets
 Pages
Pages Process AI
 Automations
 Analytics
 Apps
Apps Integrations
 Property management
 Customer management
 Human resources
 Information technology


As there are so many different types of recurring work happening in every part of your company, it can be difficult to keep track of what’s working and what’s not.
You can often spend too long looking for answers to questions like these:
“Which processes in the Sales team run smoothly and which take longer than they should?”
“Who in the Underwriting team completes their tasks on time and who misses their due dates?”
“Have we reduced the time it takes HR to complete the onboarding process, for new Account Executive hires in particular?”
“How many different processes is the IT Helpdesk team involved in, and how many tasks have they completed in the last 30 days?”
“How long does it take the Customer Success team to onboard a customer, and which onboarding tasks take the longest to complete?”
Wouldn’t it be useful to have a custom-made dashboard so you can get answers to these types of questions with one, quick glance?
Well, with the launch of Process Street BI Integrations, now you can.
To find out how you can export, store, visualize, and utilize all your Process Street data in the way that you want to, take five minutes to read through the following topics and find out:
- What is Process Street BI Integrations and who is it for?
- How Process Street BI Integrations work
- What benefits Process Street BI Integrations brings
- How to get Process Street BI Integrations
What is Process Street BI Integrations and who is it for?
Process Street BI Integrations give you an in-depth insight into all your company’s processes in a way that fits with how your organization prefers to consume data and monitor analytics.
If you need to track, measure, and report on the performance of teams and processes across the entire organization, then this is the tool for you.
For example, say you wanted to see how efficient your onboarding processes were. Using the BI Integrations, you could access all the data from all your Process Street onboarding workflows and workflow runs and create a visual representation of how this particular process is performing. You could filter the data so it shows you how many employees you’ve successfully onboarded and how long it takes them to get through the process. You could then use this information to understand how successful your onboarding process is and where improvements could be made.
BI Integrations give you real-time insights into how your teams are performing and how efficiently your processes are operating, in a way that works for you.
How Process Street BI Integrations works
Available to customers on our Enterprise pricing plan, the BI Integrations feature will export all your process data from the Process Street platform into a Snowflake Reader account.
Once the data is in the Snowflake Reader account, you can then use any data visualization tool you like, from Excel or Looker to Tableau or Power BI, to build graphs, charts, and dashboards to showcase the workflow dynamics of your company. This means you can view your process analytics in a way that works best for your business.
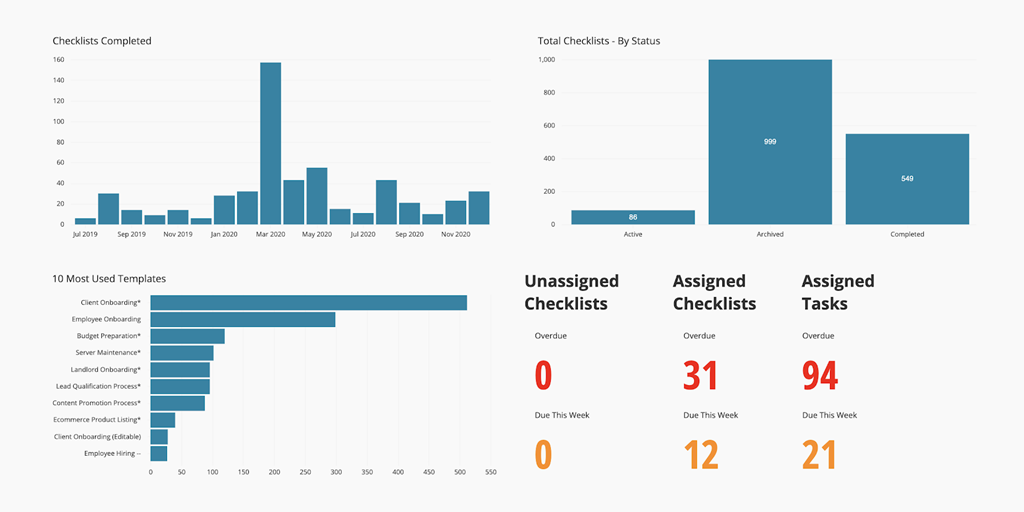
Below are two examples of how you can use the Process Street BI Integrations to create custom process dashboards.
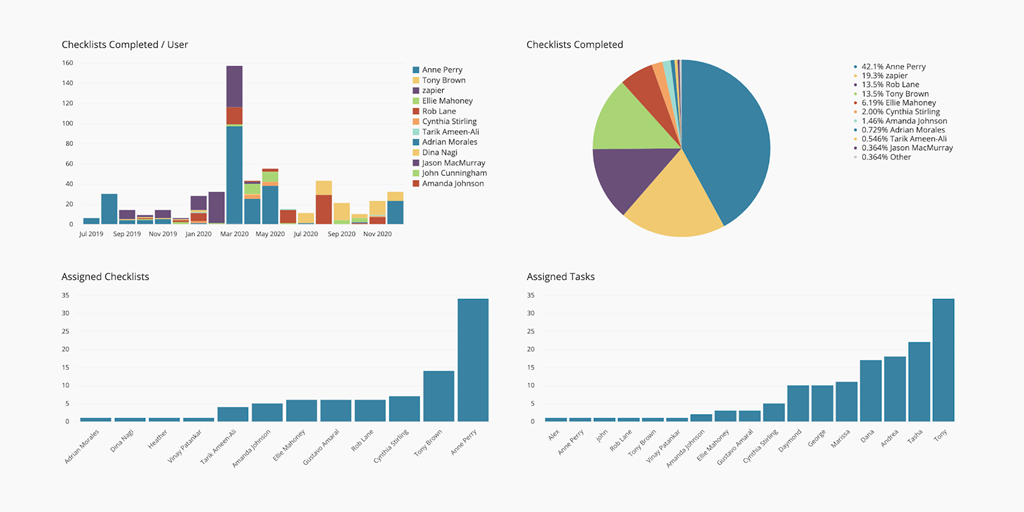
You can visualize the data however you want – the only limit is the data you have.
The benefits of Process Street BI Integrations
Consider how valuable it would be for you and your team to have a holistic understanding of every process within your company – to know what their current status is, how long they take to complete, who is accountable for which tasks, and more.
Then, imagine how beneficial it would be to be able to tie that data into the larger organizational objectives to help you spot inefficiencies, cut costs, and improve performance.
Pivot and filter your process data by workflow, workflow run, task, assignment, form fields, approval status, and task owner to get the detail you need instantly, without time-consuming data manipulation.
Combine your Process Street data with the data from other applications you use, to view how your process performance is driving financial results for your business.
Connect your workflow data to the data software of your choice, so you have the freedom to build custom dashboards and consume it in the way you want to.
Watch the below video to see how easy it is to reap the benefits of Process Street BI Integrations.
How to get Process Street BI Integrations
Process Street is the #1 business process management software, as voted for by GetApp.
With our no-code platform and easy-to-use workflow editor, you can create a process in seconds. Then, when you want to complete the process, run a single instance of that workflow as a workflow run. Assign tasks, set deadlines, send work for approval, and connect your processes to thousands of apps via Zapier, webhooks, or API integration.
Over 240,000 companies, large and small, are using our platform to power their processes. To join them and start using our BI Integrations, book a demo with our team, and start a free trial (no credit card required).
Amanda Greenwood
Amanda is a content writer for Process Street. Her main mission in life is to write content that makes business processes fun, interesting, and easy to understand. Her background is in marketing and project management, so she has a wealth of experience to draw from, which adds a touch of reality and a whole heap of depth to the content she writes.