One big thing that startups do differently to big companies is experimentation.
In reaction to the old corporate methods, startups are less like finely tuned money machines, and more like laboratories. That’s partly because of the culture of innovation, and partly because startups have less to lose by running a wrong experiment, but everything to gain if it is a success.
At Process Street, we’ve had our fair share of surprisingly positive experiments, as well as ones that were totally useless.
The more data you evaluate from other company’s experiences, the better you’ll get at running your own tests. So, in the spirit of experimentation and innovation, I’ve decided to share some of our A/B tests with you.
In this post, I’ll write up some of our growth hack results and then explore in-depth how to track and implement your own experiments so you can start improving conversions.

Home page headline: +5% conversion rate
A general rule we have at Process Street is that the most time and energy should be put into optimizing material that the most people see. This doesn’t stop us running experiments on everything from subject lines to content upgrade pop-ups, but it does mean we focus most of our time on our main landing page.
Out of all your site’s elements, the headline on the landing page is probably the most high-impact test you could run.
We’re still testing ours — we’re running an experiment and waiting for the statistical significance to peak — but here’s a test from the past that improved engagement and signups.
The control
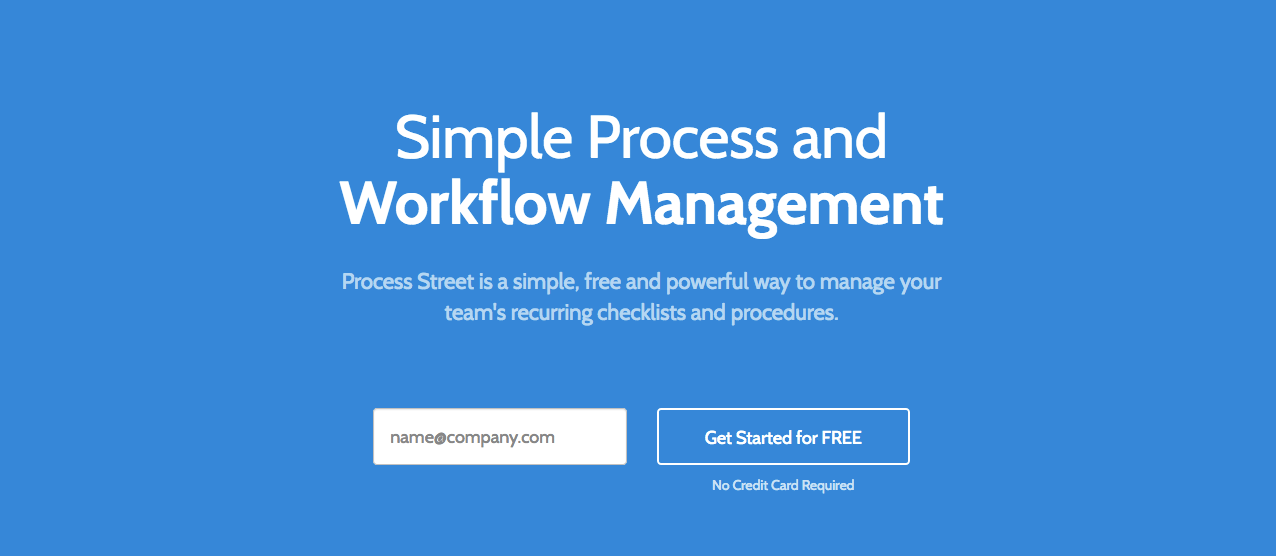
This headline had been our main one since the beginning of time.
Variant #1: -9% conversion rate
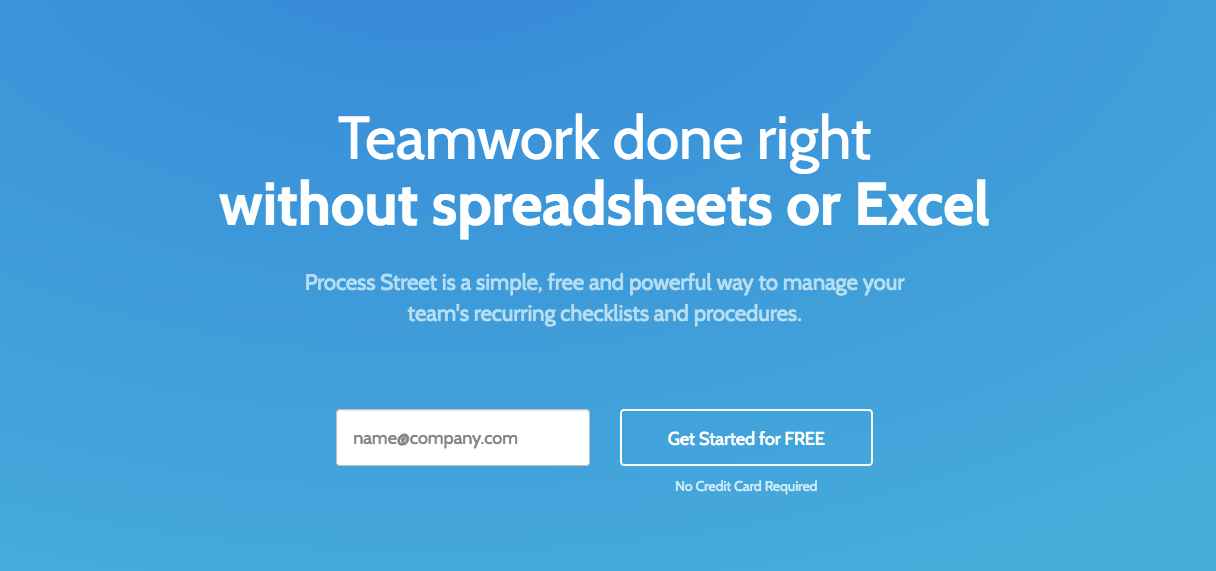
We found that a lot of our users switched over from Excel, and that they were frustrated with the limitations of spreadsheets.
Variant #2: +5% conversion rate
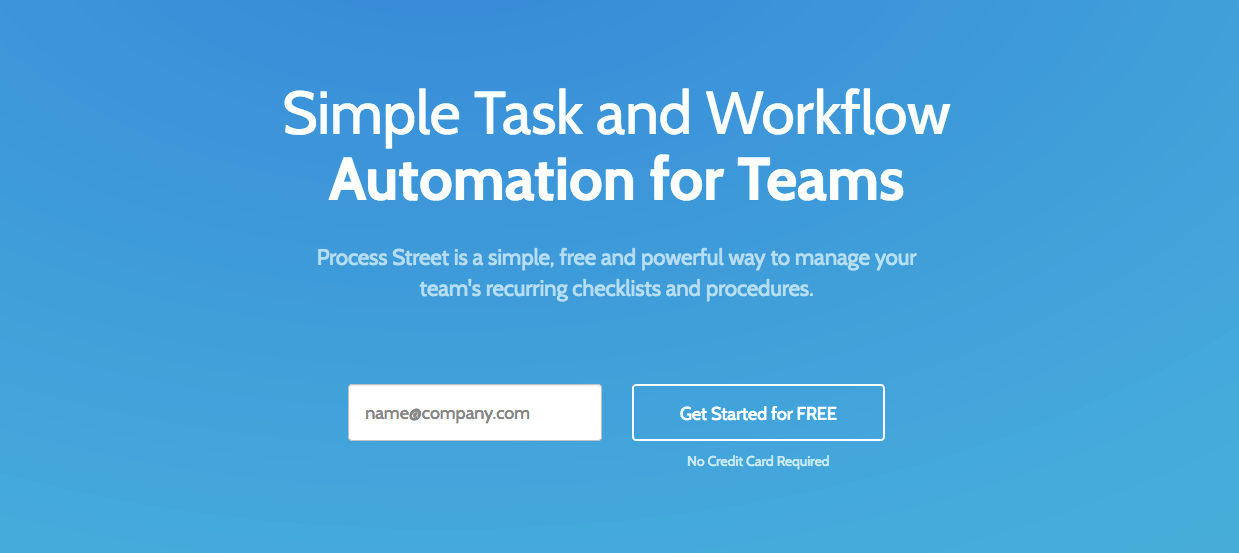
As it turns out, the focus on automation was the right choice. Since then, we’ve directed a lot of our marketing material to sell the benefits of automation, and even written a free ebook about it.
Email marketing subject line: +30% open rate, +33% click rate
When we first started optimizing our marketing emails, we got amazing results. This isn’t really because of any complex trickery or breakthroughs. It’s mostly because the email marketing we were doing pre-test was terrible. I rip it apart in this post. Here’s an extract:

Since then, we’ve started running tests in Intercom instead because it’s linked to everything — our SaaS metrics, our users, and our support conversations.
Below are the results of one of the tests since:
The control
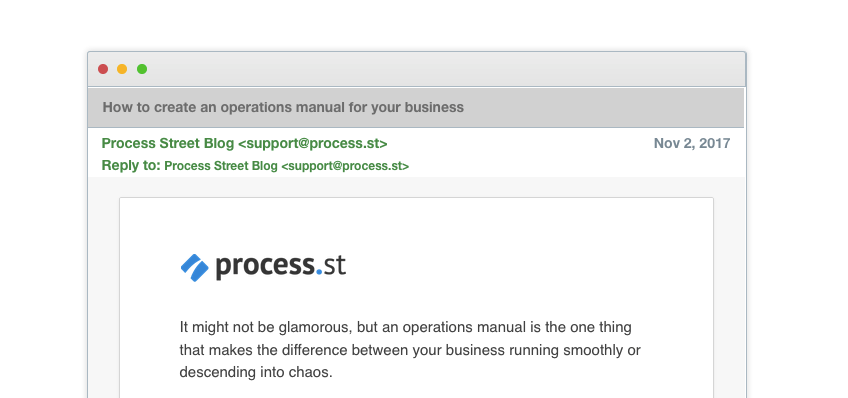
It’s straight to the point, but is it too boring?
Variant #1: +30% open rate, +33% clicks
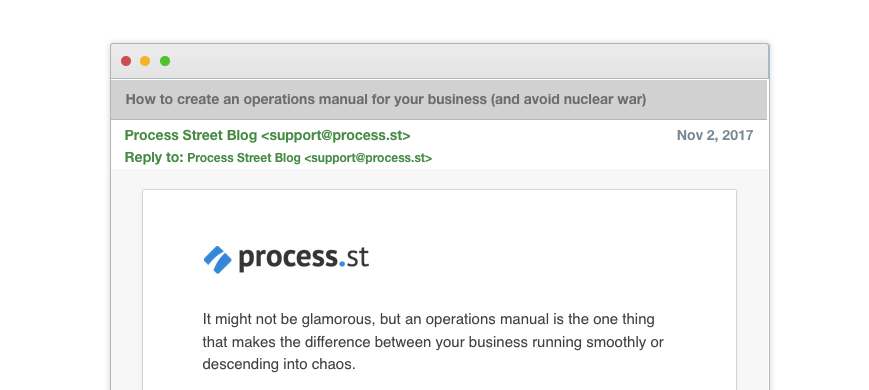
Yes, the control was too boring. The promise of avoiding nuclear war upped the open and click rates by almost a third! Including Ben Mulholland’s trademark playfulness in the subject line paid off.
Exit pop-up for Google-related posts: +196% conversion rate
A big chunk of our ranked posts are for Google-related keywords. We’ve got Gmail tips, Google Drive tips, Gmail vs. Inbox, Gmail extensions — you name it. To make better use of that traffic, we decided to add an exit pop-up. We tested the color, which bumped conversions up quite significantly, but we also changed the offer completely.
The control

Originally, we wanted to sell the reader on a content upgrade: a list of Google Drive tips. We displayed this on any Google-related post, by setting the show rules as paths that contain google.
Variant #1: +65% conversion rate

All we did here was change the color. As silly as it can seem at first, color has featured in a particularly famous A/B test in the past and makes a proven difference in conversions.
Variant #2: +178% conversion rate

We decided to up the ante and offer a free two year subscription to premium Google Drive. As you might imagine, it sent the FREE STUFF sensors off the charts.
Variant #3: +196% conversion rate

…But a terabyte of data is much more attractive than a two year subscription. This pop-up was the clear winner.
SEO title and description: +212% organic traffic
We use YoRocket to run tests on our SEO titles and descriptions. YoRocket helps you write better headlines and descriptions by checking the copy against a list of factors proven to convert:
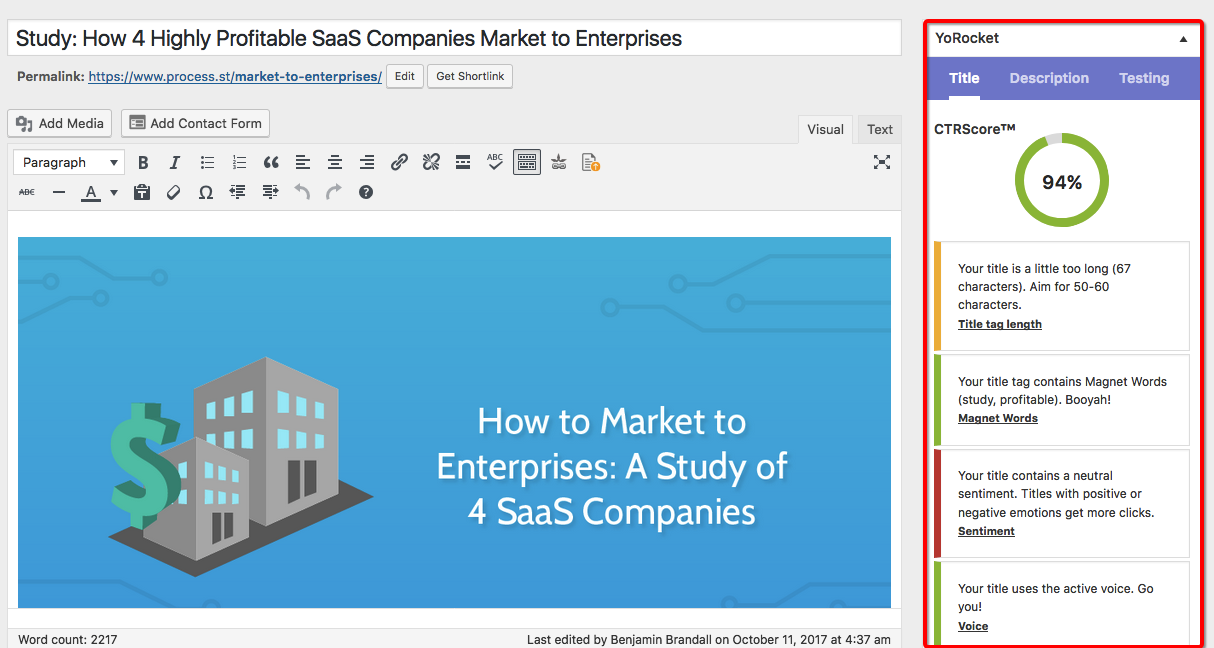
This plugin is awesome for optimizing your old content, and recently we ran a series of experiments to optimize old posts that sat somewhere between position 9 and position 4 on Google. The aim was to push them higher up by the virtue of better copy.
The most staggering result was on our timeline templates post. Here’s what happened:
The control
SEO title: Every Todo List Template You’ll Ever Need
SEO description: Need a to do list template? Check this huge list for Excel to-do list templates and Word documents, too!
Variant #1: +212% organic traffic
SEO title: Every To Do List Template You Need (The 21 Best Templates)
SEO description: Need an awesome to do list template? Check this huge list for 21 Excel to-do list templates and Word documents, too!
The main thing we added was a mention of how many templates we included in the post. Numbers are a proven conversion factor because they set expectations for the reader. And, if the number of templates is higher in our post than others, users might be more likely to click it.
How to run your own marketing experiments

Growth hacking isn’t a ‘set it and forget it’ process. It’s rooted in scientific principles, and if you’re not tracking it properly you might as well not even do it at all.
You can read all the A/B test results you want, and try to copy the winning variation…
But guess what?
The only way to find out what works for your business is to do tests yourself, track the results, and improve upon it.
The thing is, A/B tests can be anything from a quick split test on an email subject that a few hundred people will read, to a massive change to your homepage that gets hundreds of thousands of views per month.
In this section, I’m going to share with you the growth hack tracking process we’ve developed at Process Street so you can:
- Store results and future tests all in one place
- Prioritize tests better
- Run more tests
- Get your own data
- Make smarter growth hacking decisions
Use this quick structure to easily record your experiments
No matter what tool you use (we’ll get to that later), you need a structure to record experiments, whether that’s experiments you’re already running or ones in the backlog.
For this, we use Kurt Braget’s PILLARS system.
Let me explain. PILLARS means:
- Place (platform, e.g. Twitter)
- Idea (a rough summary of the idea)
- Labor (the work to be done)
- Link (where you’re directing visitors / the CTA)
- Audience (who you’re aiming at)
- ✅ Results (what you hope to get)
- Spend (how much money, time, or resources you’ll need)
Here’s an example of Kurt’s implementation of PILLARS in Microsoft Excel:

Once you’ve dumped your ideas into a spreadsheet or another tool using this system, it’ll make it much easier to give each test a priority. We use a scale of 1-5, with 5 being the highest priority, highest impact tests.
Priority will vary depending on your desired outcome — if you’re looking to start more campaigns on social media, you’d give higher priority to a test for getting followers, for example.
Fill in every detail of the highest priority test
Pick a test from your list that will have the highest impact on your current goals, and then start to flesh out the details.
Note down:
- What is your hypothesis?
- Additional notes or details
- What constitutes a winning test
- How long will the test run for?
- What is the control variable?
- What are the test variables?
There’s no point in filling all of this information in before you’ve done the basic prioritization with PILLARS, so go ahead and do this now for the test you’re definitely going to run.
We built this form into a Process Street template and run it for every test:

Get the test underway to start boosting conversion rate
After all the details are noted down, there’s nothing left to do but start building the test.
Send a list of instructions along with the variables to the person building it (if a developer’s needed, for example), or just build it yourself.
For example, if you were split-testing homepage headlines in Optimizely, you’d either give step-by-step instructions to a member of your team, or go into the app and set it up yourself.
Mark it as ‘in progress’ wherever you’re tracking it, and let the test run.
Here’s an important part you can’t afford to forget:
You need to do a spot check one day after the test has been deployed.
In my case, I’d check whether the headlines are displaying properly on the homepage, and that Optimizely is logging the results. I’d also take screenshots as I went along in case I wanted to write a blog post about the test later, or report an error to support.
Here’s how you properly track the success of your growth hacks
Did the experiment have any effect? Which test won?
This is some of the most important data you have at your disposal in your business.
It gives you insights into your customers, your best platforms, the language that resonates, and the design that converts best. Armed with that knowledge, you can make sure every campaign you run is better than the last, and your failures are just lessons to learn from that didn’t have a devastating effect.
Since you already set out the goals of the test, analysis is easy:
- Was the win condition met?
- What was the control variable?
- What was the winning test variable?
- Why did it win?
Here’s a quick example for a test we ran:

Now, let’s take a look at the different tools you can implement this system with…
How you can track your own marketing experiments
In this section, I’m going to demonstrate how each of the below tools can be used to effectively track growth hacks using the methods I outlined earlier:
Tracking marketing experiments with Trello
Trello was made to handle different tasks being pushed through the funnel as part of a larger project, which means it lends itself to tracking tests:

As you can see, each test is its own card. As they move through the funnel, more details are filled out. I’ll explain the list names:
- Brainstorm: for pasting in links for experiments you feel could be useful for the future. Anything goes.
- Backlog: once you decide to move forward with a test, you prioritize it (screenshot below)
- Designing: getting the material ready to launch
- Running: the test is in progress! It needs checking, and you need to be recording the data of experiments in this list
- Analyzed: after the run period is up, move the card here and analyze the results. What’s the outcome? Which variable won?
Prioritization and analysis looks like this inside the card:

Trello is an easy way to track experiments as they happen, and you also end up with a list of completed tests that you can write up longer analyses on if you need.
Tracking growth experiments with Process Street
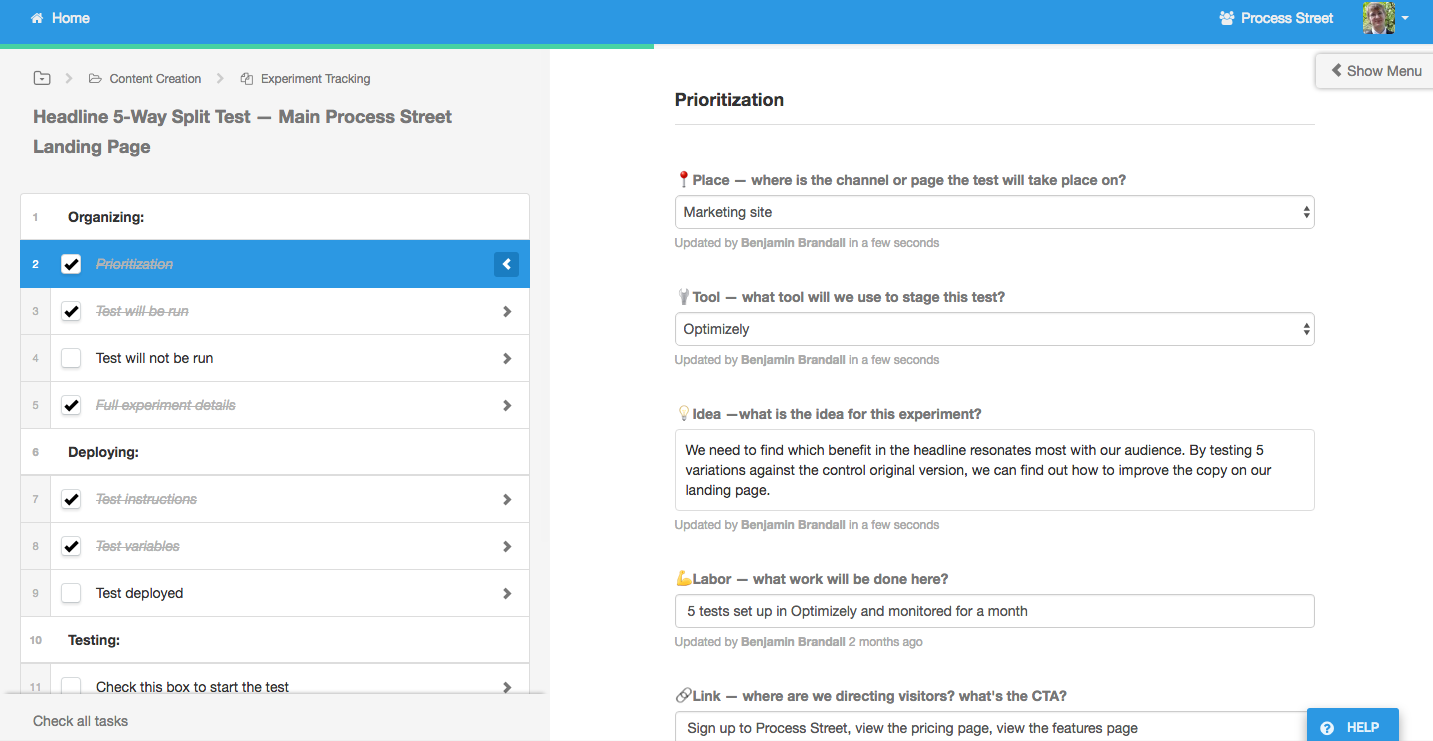
Process Street is a checklist and workflow tool that can track pretty much anything you can imagine. We created an in-house A/B testing process to help us with our own optimization, and then realized the app had a whole new use case, and can do it as well as any tailored solution could.
Here’s a more in-depth look at the process:
The idea is that you fill in as much information as is needed. If the test isn’t a priority, you only fill in the most bare-bones information. If it moves forward, then you tick a box when it’s started, fill in your analysis, etc.
Here’s what it looks like in action:
Tracking growth experiments with Google Sheets
Spreadsheets are probably the most popular way to track A/B tests. You can sort by priority, by audience, by labor, and really start to filter down on the individual elements of each proposed test. It’s more mathematical and produces more structured data than Trello, but updating progress isn’t as easy as just dragging cards into lists.
Here’s an example of the same setup as Trello translated into Sheets. As you can see, it isn’t ideal:

Off the screen, there is the same funnel as Trello. with Designing, Running, Analyzed, and a box for a long-form analysis.
These are the methods we’ve tested at Process Street, but I’m sure there must be plenty more. What are your top A/B testing tips? How do you track your experiments? Let me know in the comments.


 Workflows
 Projects
 Data Sets
 Forms
Forms Pages
Pages Automations
 Analytics
 Apps
Apps Integrations
 Property management
 Human resources
 Customer management
 Information technology


Benjamin Brandall
Benjamin Brandall is a content marketer at Process Street.