


Turn every policy into automated workflows with built-in enforcement and audit-ready proof.


Form Dashboard
A form dashboard is a control surface for form submissions. It shows what came in, what is complete, what needs attention, who owns the next step, and whether the response led to action.
That is different from a submission inbox. An inbox stores responses. A useful dashboard helps a team decide what to do with them. It connects intake to ownership, follow-up, approval, and resolution.
This guide explains how to design a form dashboard, which metrics matter, how to build one, and how Process Street can turn form responses into controlled workflows.
Use the sections below to move from a static response list to an operating view your team can trust.
- What is a form dashboard?
- Why form dashboards matter
- Essential form dashboard components
- Form dashboard metrics that drive decisions
- Form dashboard design principles
- How to build a form dashboard
- Form dashboard use cases
- Form dashboard in Process Street
- Form dashboard best practices
- Form dashboard FAQs
What is a form dashboard?
A form dashboard organizes response data into a view built for decisions. It combines summary signals with the underlying response records, then adds the context needed to manage the work: status, owner, priority, exception, due state, and next action.
A dashboard is a decision layer
The form captures information. The dashboard explains what that information means operationally. If a response is complete and low risk, it may move straight to fulfillment. If evidence is missing, it should enter an exception queue. If approval is required, the dashboard should show who must review it and whether that review is still open.
This is why the dashboard should be designed around decisions rather than charts. A count of submissions is useful. A filtered list of unassigned, incomplete submissions is actionable.
A dashboard is more than a response inbox
A response inbox answers, “What did people submit?” A form dashboard also answers, “What is happening now?” It can show whether the submission was validated, who accepted ownership, which workflow started, what is blocked, and whether the requested outcome was completed.
That distinction matters when you use a form engine for operational intake. The response is the start of work, not the end of it.
A dashboard can serve one form or many
A small team may need one dashboard for one form. A larger operation may need a portfolio view across customer intake, incident reports, employee requests, vendor reviews, and compliance evidence. The same design principle applies: start with the operating decision, then include only the data needed to make it.
A managed form process service becomes especially valuable when multiple forms must follow the same ownership, review, and resolution rules.
Why form dashboards matter
Forms make it easy to collect information. They do not automatically create control. Without a dashboard and a response process, submissions scatter across inboxes, spreadsheets, exports, and chat threads. Teams lose time reconstructing what happened and deciding who should act.
They make ownership visible
Every operational response should have a clear owner. The dashboard should make unassigned work obvious and show when ownership changed. This removes the common gap where everyone can see a request but nobody is responsible for closing it.
They surface exceptions early
Incomplete evidence, invalid values, duplicate submissions, overdue reviews, and high-risk answers should not hide inside individual records. A dashboard groups these exceptions into focused queues so the right person can resolve them before they become delays or control failures.
This turns the dashboard into a practical layer of workflow monitoring, not a decorative analytics page.
They connect intake to outcomes
Submission volume alone does not tell you whether the process worked. A form dashboard should connect the original response to the action it created. That might be an assigned service request, an approved vendor, a resolved incident, a completed onboarding task, or a closed compliance exception.
An operations management dashboard follows the same rule: the best view shows where work stands and what needs intervention.
Essential form dashboard components
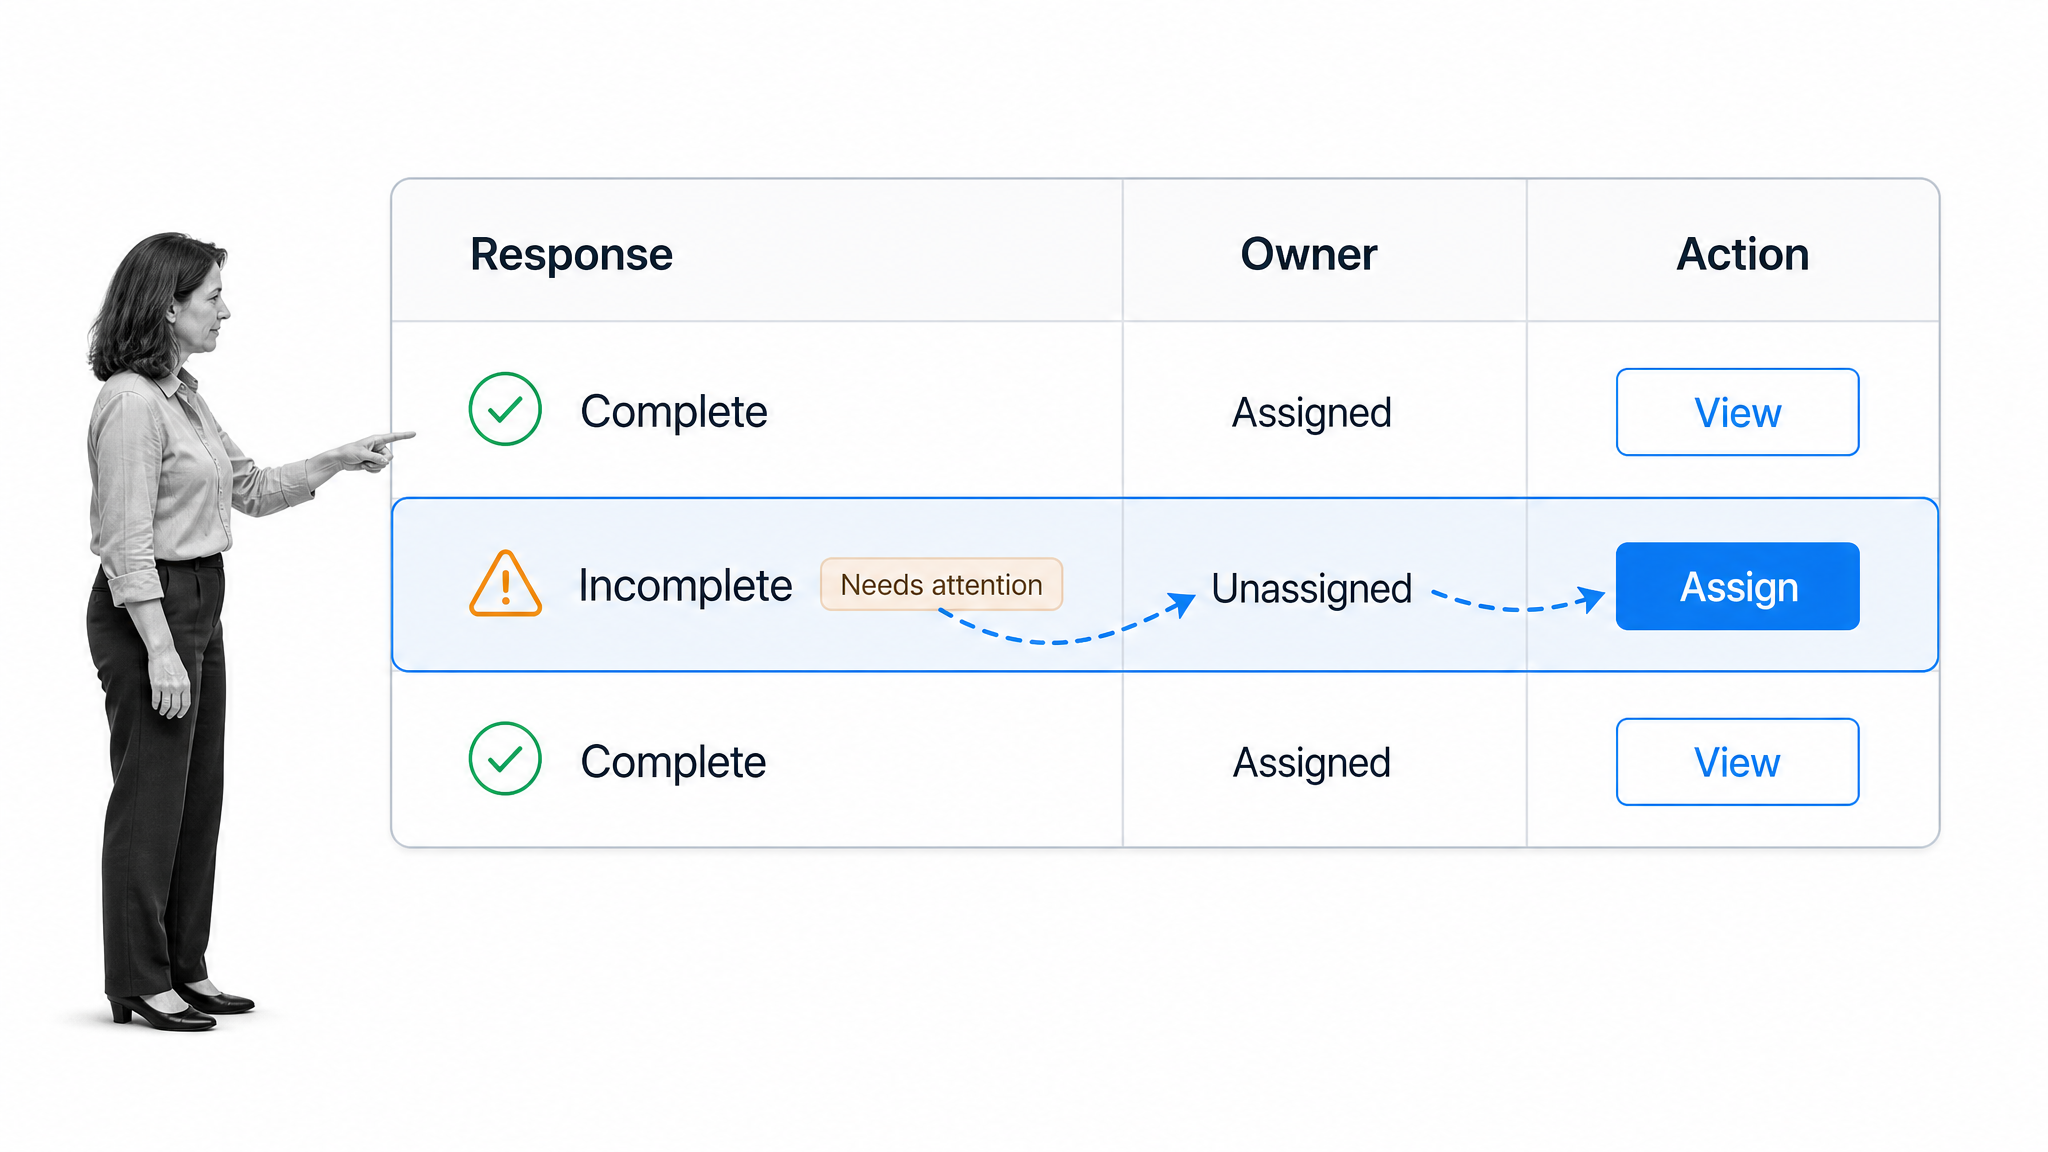
A useful dashboard needs enough detail to explain the work without becoming another database screen. The strongest design usually combines a small summary layer, a response table, focused filters, ownership, exception state, and action status.
Summary signals
Use a few top-level signals to orient the reader. Good examples include new responses, incomplete responses, unassigned responses, open actions, and overdue reviews. Each signal should open or correspond to the records behind it. A number without a drill-down path creates curiosity, not control.
Response detail
The record table is where people investigate and act. Show the fields that help a user understand the request, its state, and its next step. Avoid adding every form field as a column. Wide tables create horizontal scrolling and bury the operational signal.
The Home Office accessible forms guidance emphasizes clear labels, instructions, and logical structure. The same discipline improves dashboard readability after a response is submitted.
Filters and saved views
Filters let different teams use the same response data without building separate dashboards. Common filters include form, response status, owner, department, location, priority, risk, and action state. Saved views turn recurring filter combinations into stable working queues.
Ownership and action state
A response should show who owns the next step and what that step is. Use plain states such as unassigned, assigned, in review, approved, rejected, blocked, and closed. If the dashboard cannot show the action state, users will still need a second system to understand whether anything happened.
An issue reporting workflow is a simple example: the form captures the issue, then the operating view tracks owner, investigation, response, and resolution.
Exception queues and evidence
Exceptions deserve their own view. Group missing files, invalid fields, overdue approvals, duplicate records, and high-risk responses into queues with clear owners. Preserve the original response and supporting files so a reviewer can see the evidence without searching another system.
A reporting workflow template can define how these dashboard views are reviewed, who records decisions, and when the underlying process should change.
Form dashboard metrics that drive decisions
Choose metrics that explain demand, data quality, speed, workload, and outcome. Do not start with every number the form tool can calculate. Start with the decisions your team must make, then choose the smallest metric set that supports those decisions.
Submission volume and mix
Track how many responses arrive and how the mix changes by request type, source, department, location, or risk class. Volume helps with staffing and capacity. Mix explains what kind of work is entering the system.
Completion and abandonment
Completion rate shows how often people finish the form after starting it. Abandonment points to unclear questions, excessive length, technical friction, or requests for information the respondent does not have. Interpret these metrics by form and audience. A short public contact form and a regulated evidence submission should not share the same benchmark.
The GOV.UK performance data guidance recommends connecting service data to user outcomes and using it to improve the service, rather than reporting numbers in isolation.
Data quality
Track missing required information, invalid formats, duplicate records, failed validation, and requests returned for clarification. Data quality metrics show where the form design or instructions need work. They also protect downstream workflows from bad input.
Response and resolution time
Measure the time from submission to first owner response, then from submission to final resolution. The first metric reveals whether intake is being acknowledged. The second reveals whether the process is completing its job. Break these down by request type and priority so urgent work does not disappear inside an overall average.
Backlog and outcome
Backlog is the number of open responses that still require action. Pair it with age bands, owner, and blocked state. Then track the actual outcome: approved, fulfilled, resolved, rejected, withdrawn, or closed. A dashboard that stops at “submitted” cannot tell you whether the process delivered value.
Form dashboard design principles
Good dashboard design reduces the time between seeing a signal and taking the correct action. It does not try to display the whole database at once.
Design for one audience and job
An executive needs trend and risk signals. An operations manager needs workload and bottlenecks. A frontline owner needs a focused queue. A compliance reviewer needs evidence and exceptions. Create a clear primary view for each job rather than one universal screen that serves nobody well.
Microsoft dashboard design guidance recommends designing for the audience, keeping the most important information prominent, and avoiding unnecessary visual clutter.
Use hierarchy and context
Put the main operating signals first, the response table second, and detail on demand. Add definitions for any metric that could be interpreted differently. Show the filter state so users know which records are included. Use color sparingly for exceptions, selected states, and action cues.
Tableau dashboard best practices stress a clear purpose, controlled view count, and deliberate use of filters. These principles apply whether the dashboard lives in a BI tool or directly beside the form workflow.
Control filters and permissions
Decide which filters affect the whole dashboard and which affect one view. The Looker dashboard filter documentation shows why filter scope and field mapping must be explicit. A filter that silently changes only part of a dashboard can create wrong conclusions.
Permissions matter too. Limit sensitive response data to the people who need it. Separate dashboard access from the ability to edit form fields, routing rules, saved views, or workflow logic.
How to build a form dashboard
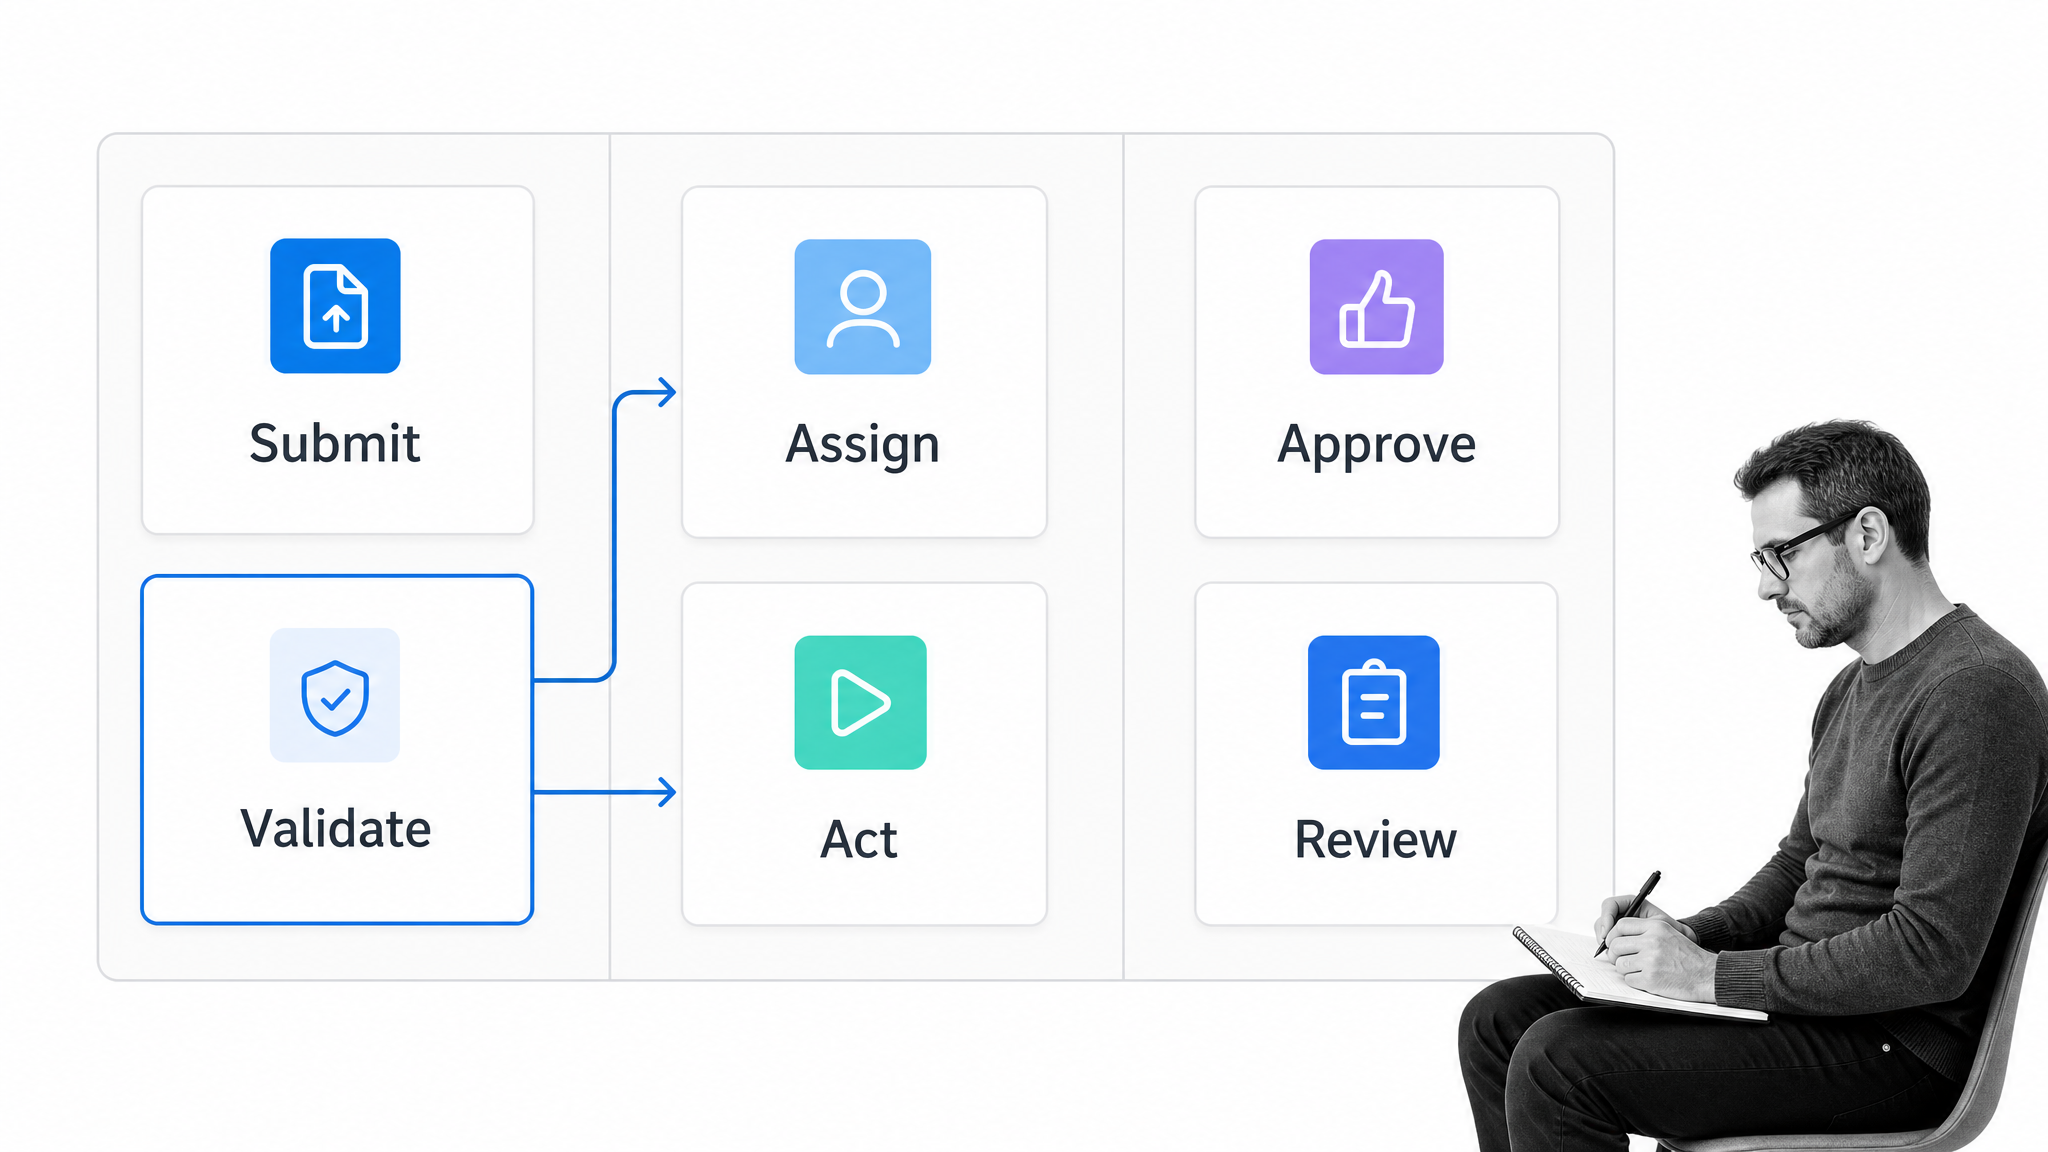
Build the dashboard from the operating decision backward. The steps below keep the work grounded in actual response handling.
1. Define the decision
Write down what someone should be able to decide from the dashboard. Examples include assigning new requests, finding missing evidence, approving high-risk submissions, balancing workload, and checking whether response targets are being met. If the decision is vague, the dashboard will become a collection of unrelated charts.
2. Map the response lifecycle
Document what happens from form open to final outcome. Include validation, assignment, review, approval, fulfillment, escalation, and closure. A dashboard cannot show meaningful status if the underlying process has no agreed states.
A practical introduction to form automation can help identify which handoffs should happen automatically after submission.
3. Standardize fields and states
Use controlled values for the fields that drive filtering and routing. Standardize status, owner, priority, request type, risk, and outcome. Free-text fields are useful for context, but they are weak dashboard dimensions. Define how blank, unknown, and not-applicable values should behave.
4. Choose the smallest metric set
Select the metrics that support the decisions from step one. Most teams can start with volume, incomplete responses, unassigned work, first response time, open backlog, and final outcome. Add a metric only when someone owns a decision tied to it.
5. Build views for action
Create saved views such as New and unassigned, Missing evidence, Needs approval, Overdue follow-up, and Closed this period. Each view should have an owner and a normal review cadence. This turns the dashboard into a set of working queues.
A guide to form data collection can help connect field design to the downstream process the data must support.
6. Connect alerts and workflows
Use rules to assign owners, start workflows, request missing evidence, escalate overdue work, and route approvals. The dashboard should reflect these actions rather than forcing a user to perform every handoff manually. Keep the automation rules close to the process definitions so teams can understand why a response took a particular path.
7. Test exceptions and review the dashboard
Test incomplete, duplicate, urgent, high-risk, rejected, and withdrawn submissions. Confirm that each one appears in the correct view with the right owner and action. Then review the dashboard with the people who will use it. Remove anything they cannot act on and add context where they hesitate.
Form dashboard use cases
The pattern works anywhere a form creates an obligation. The fields and metrics change, but the dashboard still connects response, owner, action, and outcome.
Incident and issue intake
An incident reporting form workflow can feed a dashboard for new incidents, severity, assigned investigator, evidence state, corrective action, and closure. Exception views help teams find unassigned or overdue investigations quickly.
Customer feedback
A customer feedback survey process can separate general feedback from urgent service recovery. The dashboard can show response theme, account owner, follow-up state, and whether the feedback produced a product, support, or process action.
Employee operations
An employee onboarding workflow can use form responses for equipment, location, access, payroll, and manager inputs. The dashboard can show missing information, task ownership, blocked setup work, and onboarding completion.
Compliance and service requests
Compliance teams can track policy exceptions, evidence requests, attestations, and control reviews. Service teams can track request type, priority, owner, first response, resolution, and reopened work. In both cases, the dashboard should preserve proof of how the submission was handled.
Form dashboard in Process Street
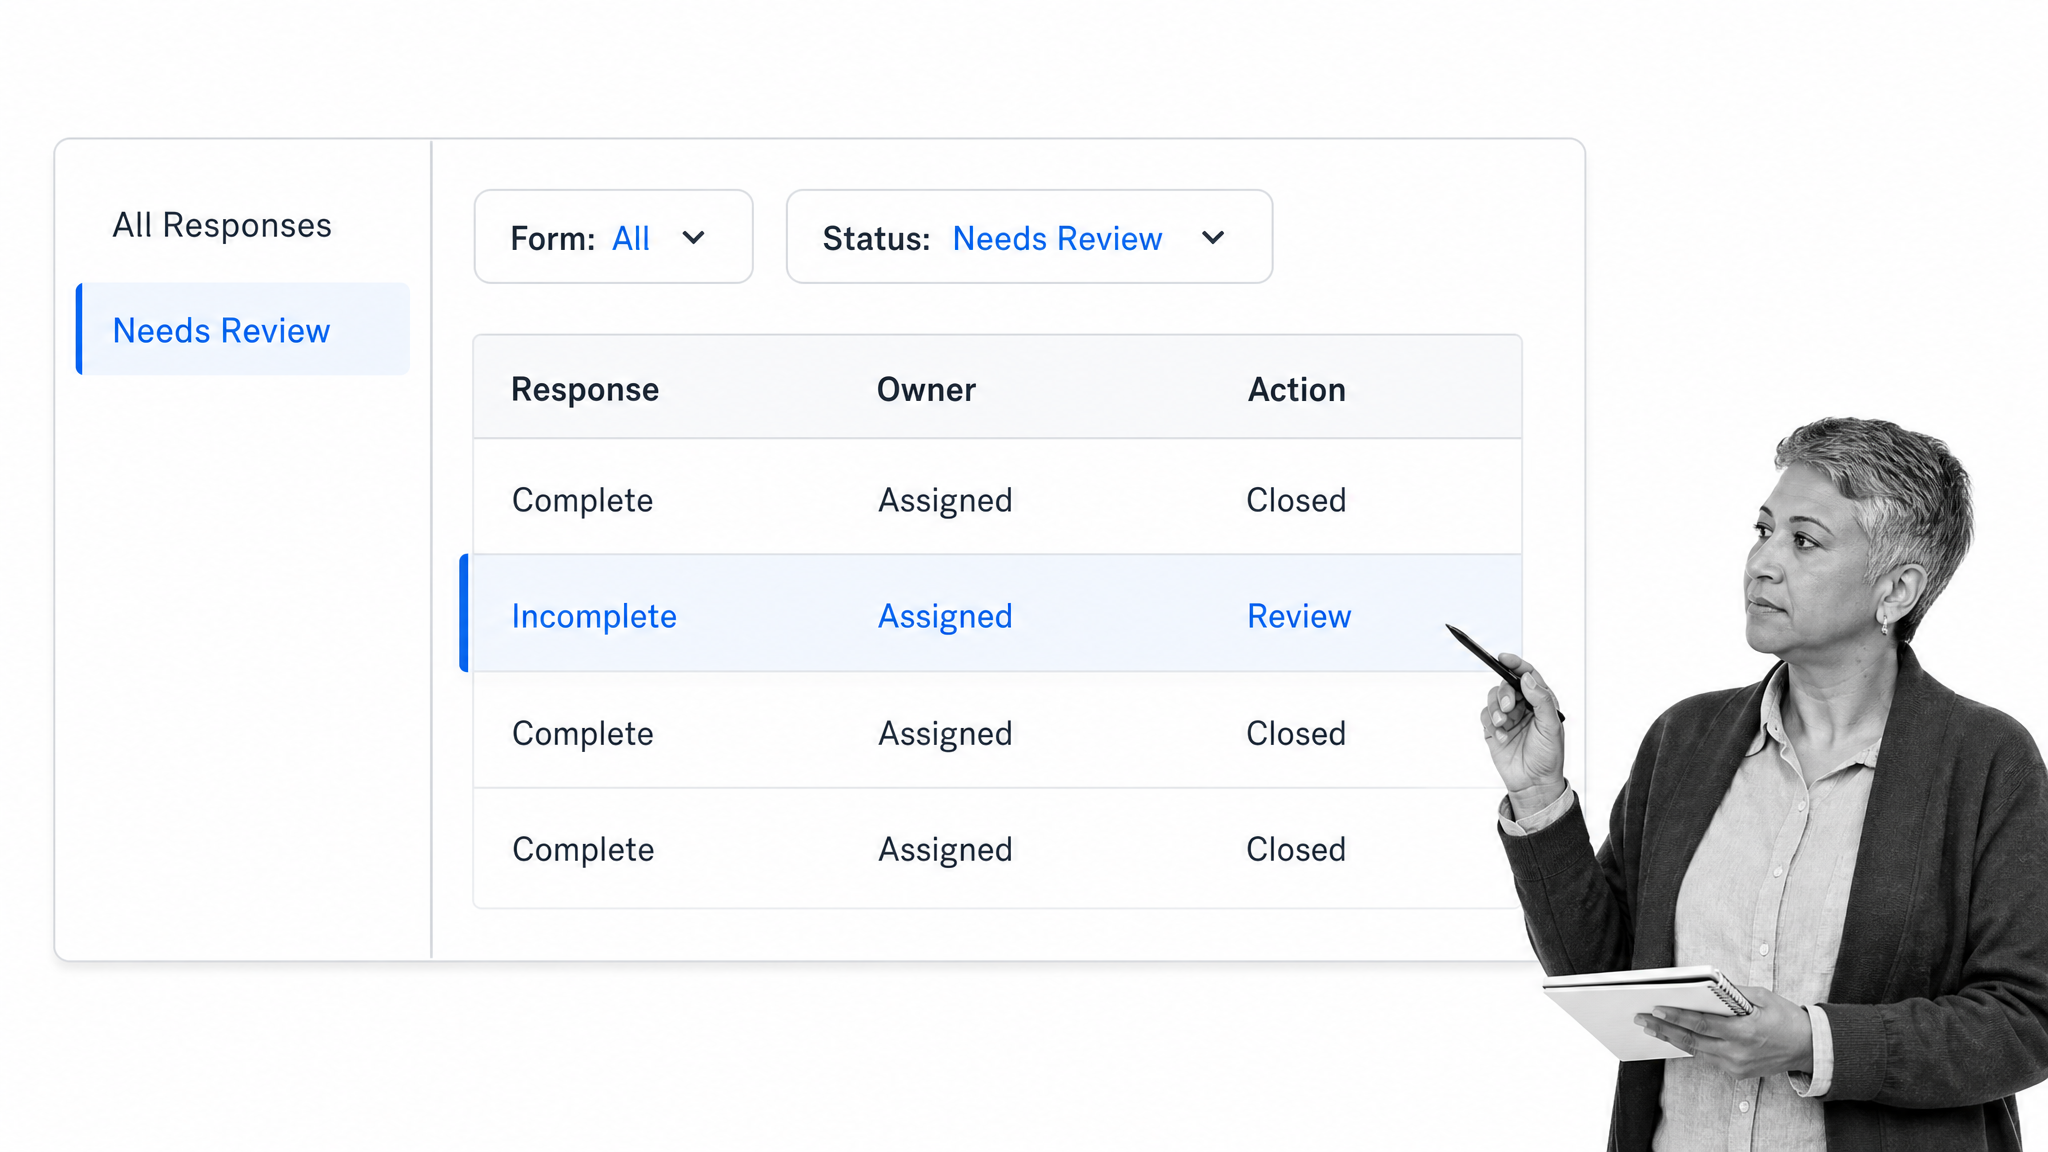
Process Street is a Compliance Operations Platform that connects structured intake to repeatable execution. The form captures the response. Reports and saved views organize the operating data. Workflows assign the work, enforce required steps, and preserve the record.
Collect structured responses with Forms
Process Street Forms collect structured responses and can connect the response to a Workflow or another application. This lets the intake surface start the controlled process instead of ending in a passive export.
Build working views in Reports
The Reports dashboard can show form fields as columns, filter records by form-field values, and save the configured view. A team can create focused views for unassigned responses, missing evidence, open approvals, or any other recurring operating queue.
Use Data Sets for controlled reference data
Data Sets store structured tables for use in Workflows and Forms. They are useful when forms need consistent reference values such as locations, departments, vendors, control owners, or service categories.
Connect the dashboard to workflow activity
The Workflow Dashboard provides a workflow-level activity view and links into a custom report. Together, these surfaces connect form response data with the work created from it.
The result is a closed operating loop: collect the response, validate the data, assign the owner, run the workflow, review the outcome, and keep proof of completion.
Form dashboard best practices
Give every view an owner
A saved view without an owner becomes another unattended inbox. Define who reviews each queue, how often they review it, and what action they take. Escalate only when the normal owner misses the agreed response window.
Define every metric and state
Write a short definition for completion, response time, resolution, backlog, overdue, and exception. Document when the clock starts, when it stops, and which records are excluded. Shared definitions prevent teams from arguing about the dashboard instead of improving the process.
Keep the main view small
Use the main dashboard for the signals and queues people need every day. Put deeper analysis in secondary views. Remove fields, charts, and filters that do not change a decision. A smaller dashboard is easier to trust, faster to scan, and simpler to maintain.
Review the process behind the dashboard
When the same exception appears repeatedly, do not just clear the queue. Fix the form question, validation rule, instruction, assignment logic, or workflow step causing it. The dashboard should help the process improve, not normalize recurring failure.
Schedule a regular dashboard review with the process owner. Remove unused views, confirm permissions, inspect recurring exceptions, and check that every alert still leads to a clear action.
Form dashboard FAQs
What is a form dashboard?
A form dashboard is an operating view for form responses. It combines response data with status, ownership, exception, action, and outcome information so a team can manage what happens after submission.
What should a form dashboard include?
A form dashboard should include a small set of summary signals, a response table, useful filters, saved views, owner, action state, exception queues, and links to the underlying response or workflow record.
Which form metrics should you track?
Start with submission volume, completion, abandonment, data quality, first response time, resolution time, open backlog, and final outcome. Choose only the metrics that support a real operating decision.
How do you build a form dashboard?
Define the decision, map the response lifecycle, standardize fields and states, select a small metric set, build saved views for action, connect workflows and alerts, then test common exceptions with the people who will use the dashboard.
What is the difference between a form dashboard and form analytics?
Form analytics explains response behavior, such as volume, completion, and abandonment. A form dashboard can include those metrics, but it also manages the operational state of each response, including owner, review, follow-up, approval, and resolution.
How does Process Street support form dashboard workflows?
Process Street Forms collect structured responses, Reports organize records into filtered saved views, Data Sets provide controlled reference data, and Workflows assign and track the actions created from each response.