Being able to view the performance of your processes, your team, or clients is critical to making sure all your work is on track.
Review the progress of tasks, workflow runs, and monitor how many runs are being completed over time.
Users: Admins, Builders, Users and Guests can see Reports, however, what they can see is determined by the permissions you have set them.
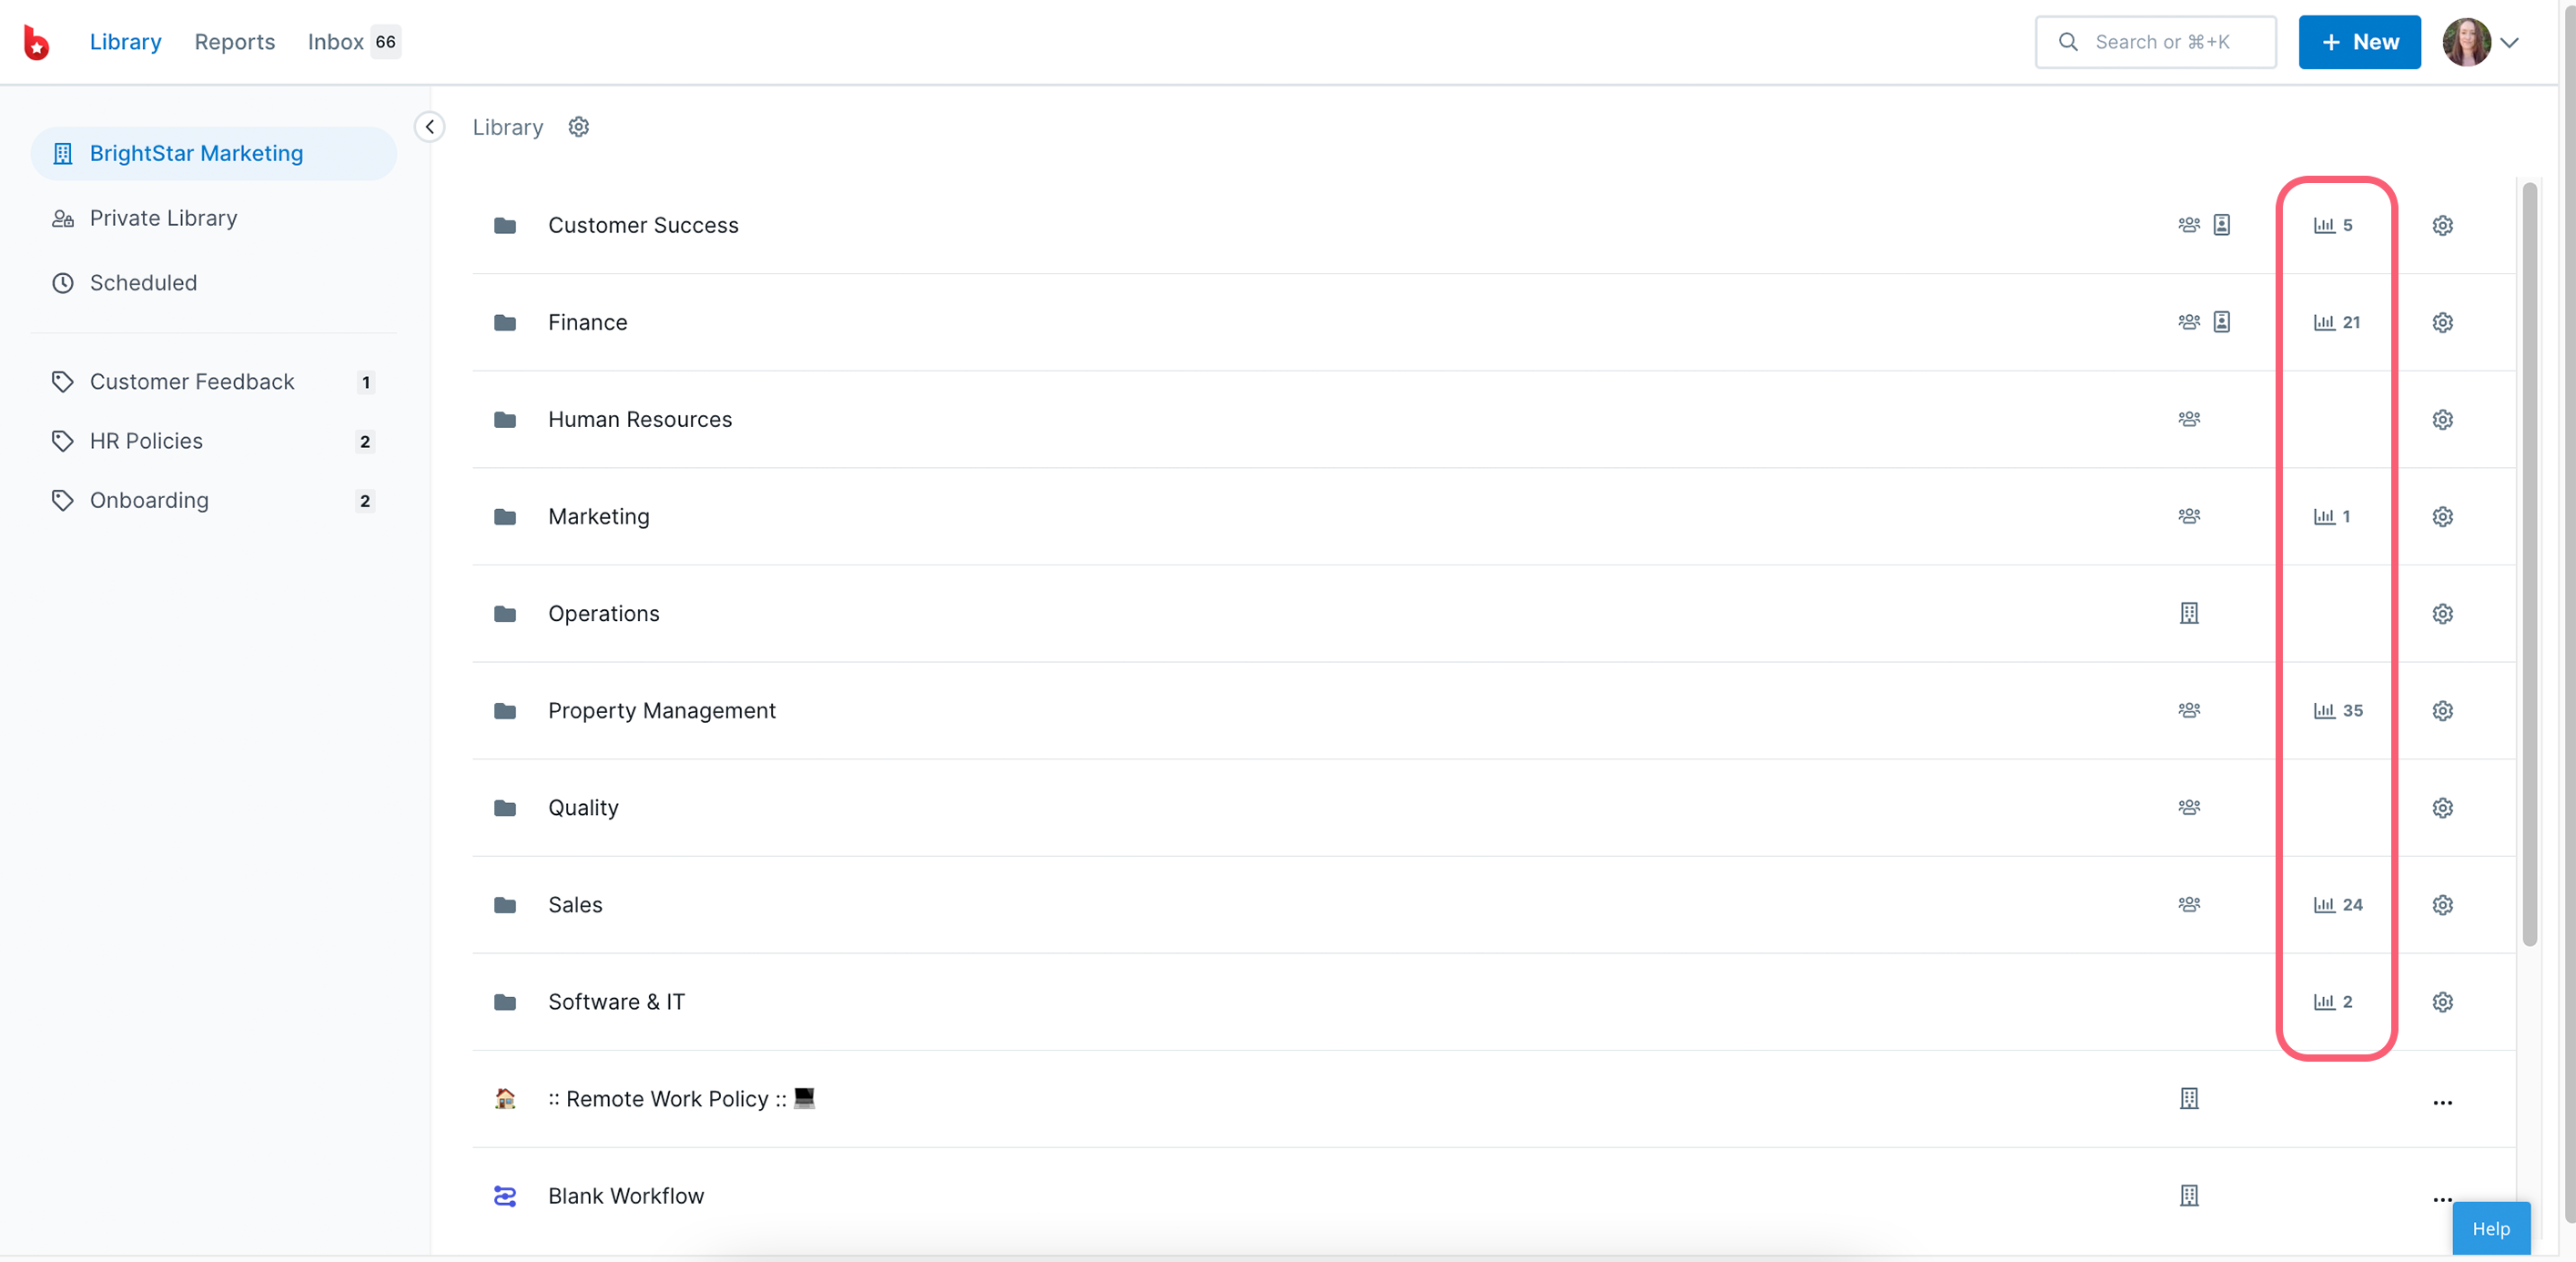
Access analytics from your library via the chart icons which relate to the number of active workflow runs you have, or head straight to your reports tab.
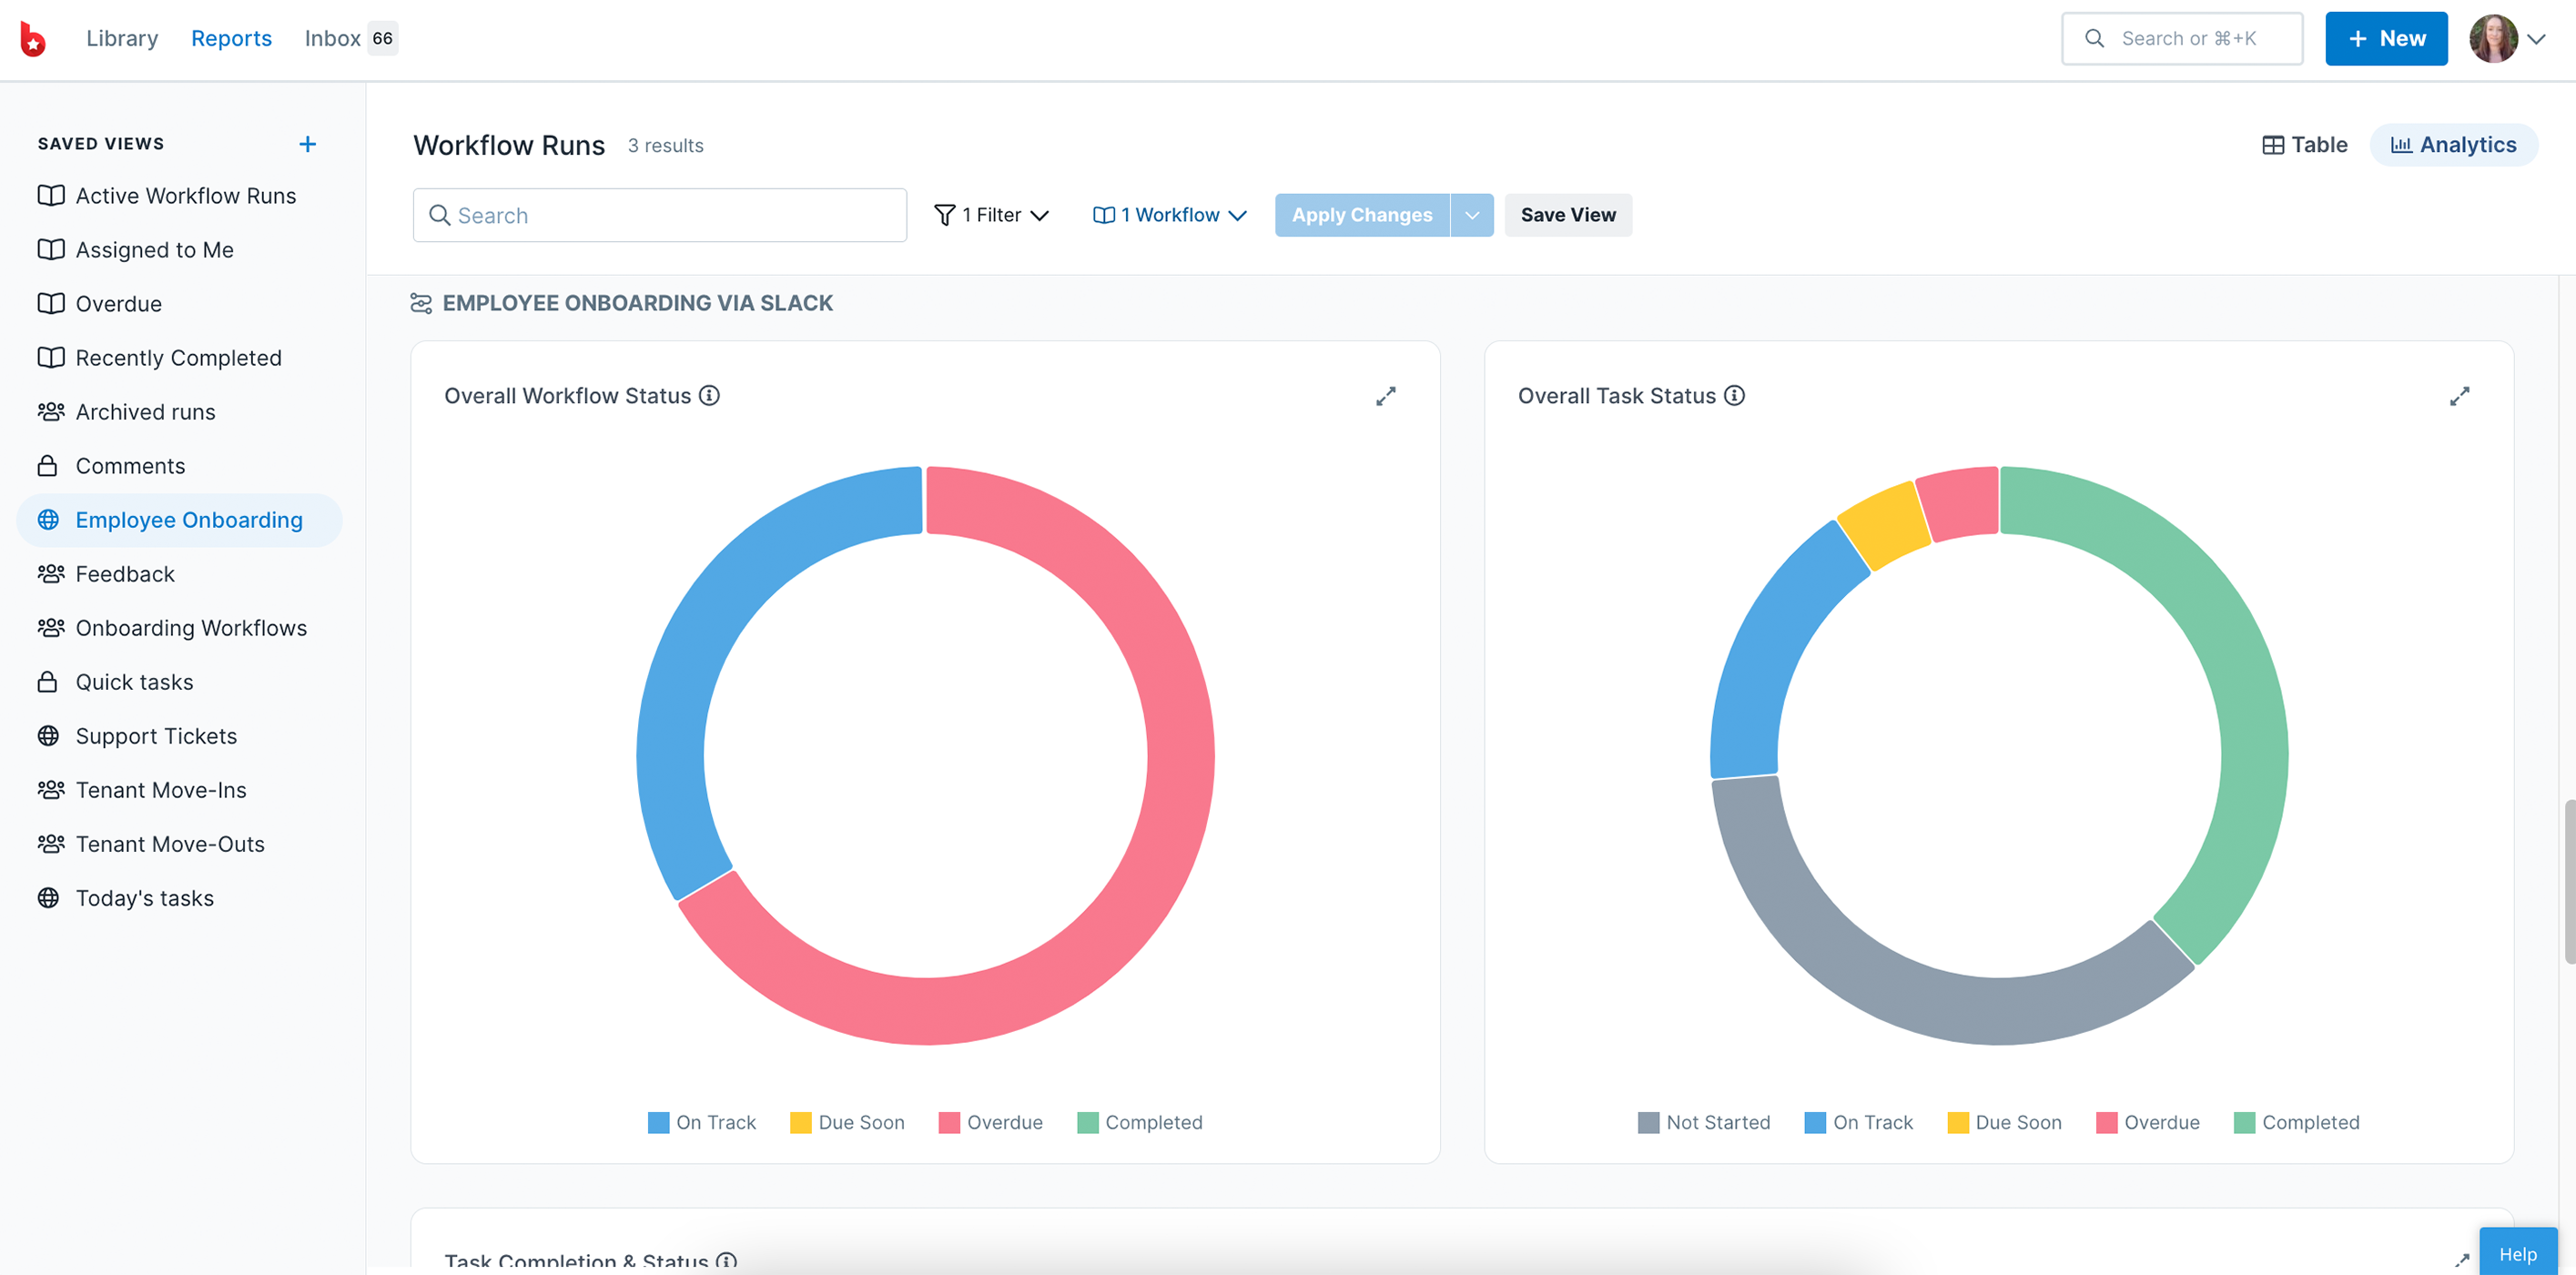
Select a saved view from the left of your screen, and then switch from table view to analytics view in the top right corner of your screen, as shown below.
Select either a single workflow or select all your workflows. Adjust the filters to change the data you see in your charts.
Selecting one workflow gives you a detailed view with both workflow run data and task data, while selecting all your workflows gives you an overview of workflow run data across every workflow.
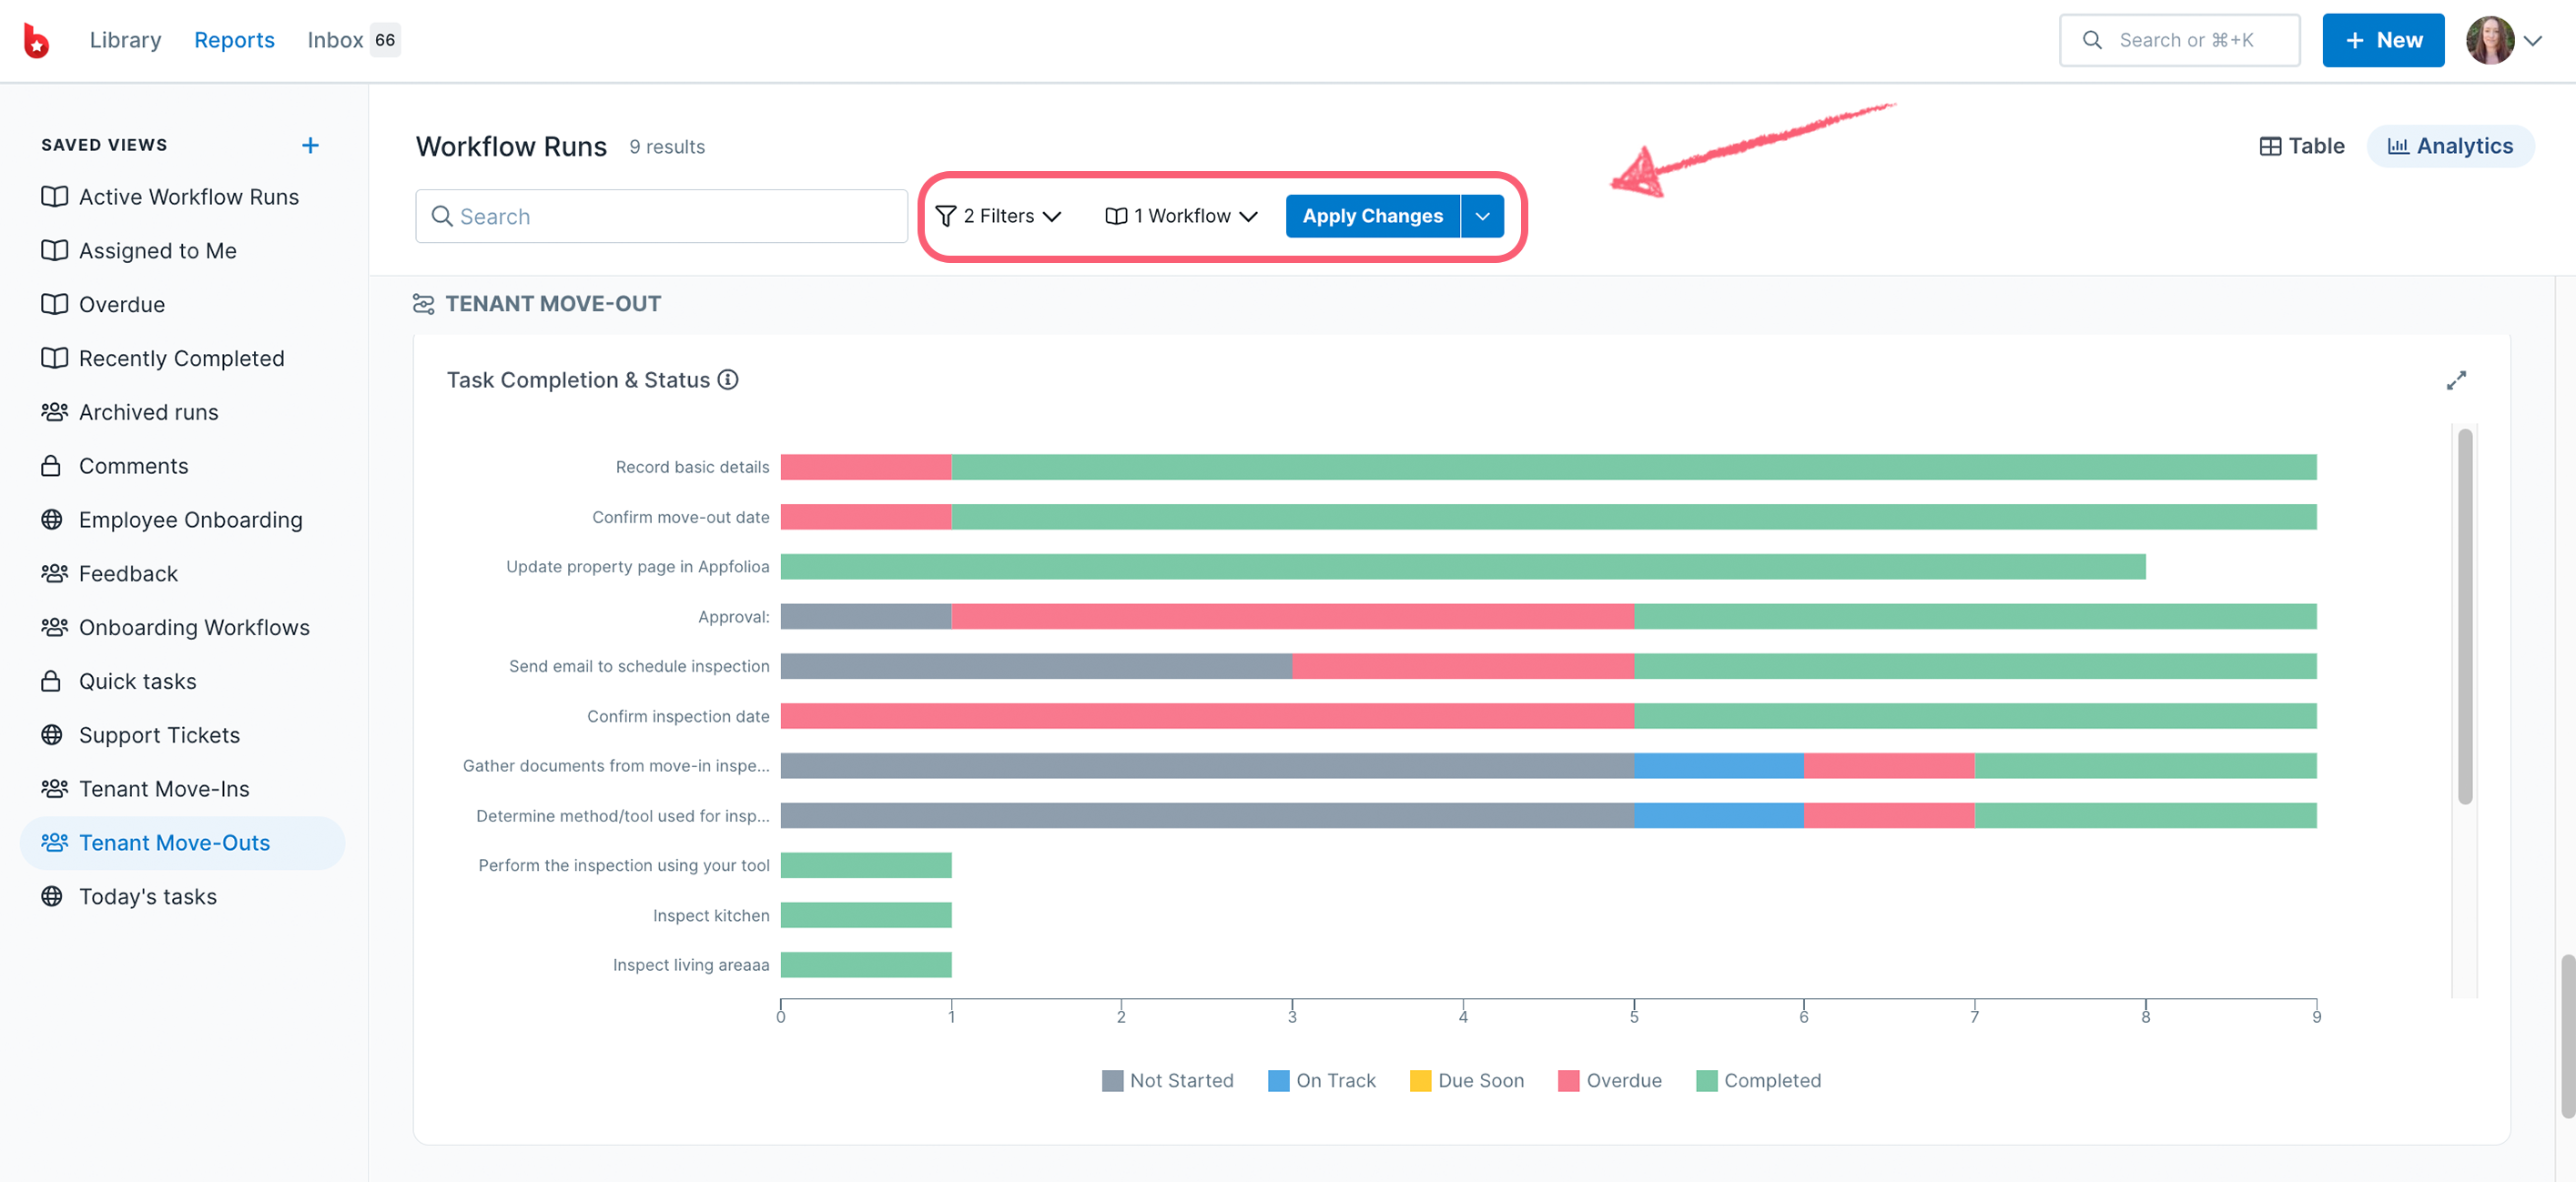
Click Apply to update your charts.
Next, save your view so that your charts will be visible the next time you click on your saved view.
Note: If your charts don’t load stating ‘Not enough data yet‘, it is likely because you need to assign your workflow runs or tasks to your team first.
Selecting a single workflow displays 8 charts covering both workflow run and task data:
Selecting all workflows displays 2 charts with a high-level overview of workflow run data:
Click on the expand icon on any chart to view it full screen. Next, click the download button to download your chart as a PNG file.
This allows you to use your charts in slide decks, or anywhere else you’d like to report your data.
Learn more about using Reports.
Contact our support team if you need any additional help.
Help us improve this help center.