

Turn every policy into automated workflows with built-in enforcement and audit-ready proof.



A Practical Guide to Relative Value Arbitrage

Relative value arbitrage is an investment approach that seeks profit from a change in the price relationship between related instruments. A typical position buys the instrument judged cheap, sells the instrument judged rich, and aims to earn the spread movement while reducing broad market exposure.
The word arbitrage can be misleading. Pure arbitrage locks in a payoff from equivalent cash flows. Most relative value trades are not pure arbitrage. They are convergence trades built on a model, a hedge, and a belief that a relationship will normalize. That leaves real risk if the relationship changes, financing tightens, liquidity disappears, or the position cannot be maintained.
This guide explains how relative value arbitrage works, how to structure and review a trade, which strategy families use it, and how an investment team can govern the full research-to-review process. It is educational information, not investment, legal, tax, or accounting advice.
In this guide:
- What is relative value arbitrage?
- How does relative value arbitrage work?
- What makes two instruments related?
- How do you build a relative value trade?
- What does a relative value arbitrage example look like?
- Which relative value strategies are common?
- What are the main risks?
- Which controls should an investment team use?
- How can a team govern research and execution?
- Relative value arbitrage FAQs
What is relative value arbitrage?
Relative value arbitrage compares instruments that share an economic relationship, then expresses a view on the difference between them. The relationship might come from similar business exposure, related cash flows, neighboring points on a yield curve, two securities in one capital structure, a convertible bond and its underlying stock, or a cash instrument and a derivative linked to it.
A Bank of Canada working paper describes fixed-income relative value as apparent deviations from no-arbitrage relationships and connects limits to arbitrage with volatility and funding costs. That framing captures the central trade-off: a spread can look attractive precisely when the capital needed to hold it becomes scarce or expensive.
| Concept | What it means | What can go wrong |
|---|---|---|
| Relationship | A defensible reason the instruments should move together | The economic link weakens or changes |
| Spread | The measured difference used to size, enter, and exit | The chosen measure hides another exposure |
| Hedge | Offsetting positions intended to reduce unwanted risk | The hedge ratio is unstable or incomplete |
| Convergence | The spread moves toward the expected relationship | The spread widens, persists, or changes regime |
| Carry | Income and financing effects while the trade is open | Borrow, funding, or hedging costs consume the edge |
Market-neutral is therefore an objective, not a guarantee. A trade can have low net dollar exposure and still carry duration, volatility, credit, liquidity, factor, convexity, or event exposure. The risk review should name each residual rather than relying on one neutrality label.
How does relative value arbitrage work?
The process starts with a hypothesis about a relationship, not with a chart that happens to look unusual. The analyst defines why the instruments belong together, how to measure their spread, which risks should be hedged, and what evidence would show that the thesis is wrong.
- Define the economic relationship between the instruments.
- Choose a spread or residual that reflects that relationship.
- Estimate a hedge ratio using economically appropriate risk units.
- Test the relationship across different market regimes and stressed periods.
- Model transaction costs, short borrow, financing, margin, slippage, and carry.
- Set entry, target, stop, time-limit, and thesis-invalidation rules.
- Complete independent model, risk, legal, compliance, and trade-readiness checks.
- Monitor the spread and every residual exposure until the position is closed and reviewed.
The spread is not the thesis. The thesis explains why the spread exists, why it may close, and what would prove that the relationship has changed.
A backtest can show how a rule behaved in historical data. It cannot prove that the same relationship will survive new liquidity conditions, a different rate regime, a corporate action, or crowding by other traders. Research should separate discovery data from validation data, include realistic costs, and document every discretionary change made after results were observed.
What makes two instruments related?
A strong pairing has an economic or contractual anchor. Correlation alone is not enough. Two prices can move together for years because they share one factor, then diverge when their businesses, financing, index membership, liquidity, or investor base changes.
Equivalent or linked cash flows
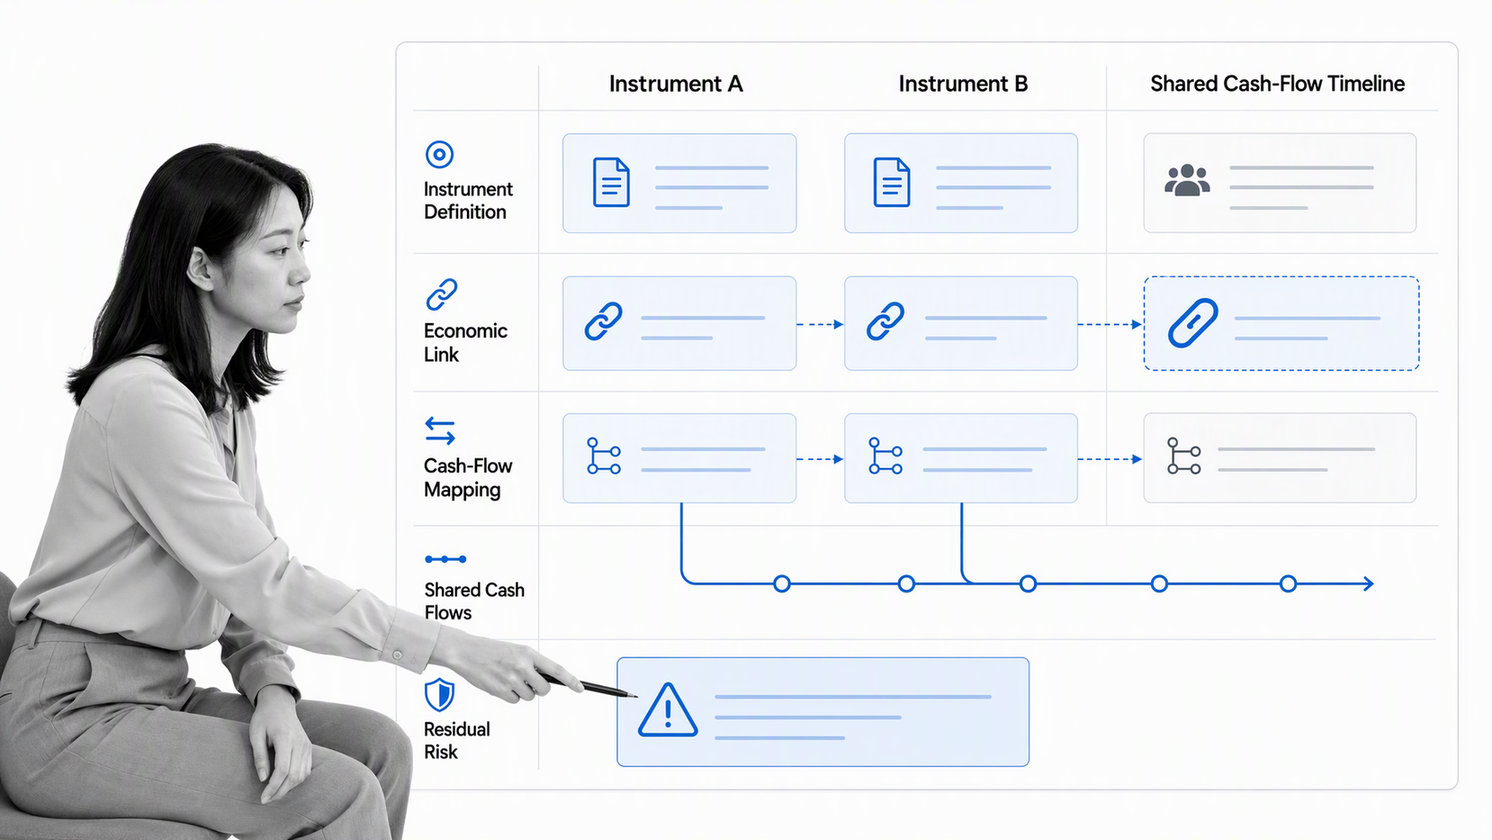
The closest cases to pure arbitrage involve instruments whose cash flows are identical or linked by delivery, conversion, or replication rules. Even then, taxes, settlement conventions, financing, optionality, counterparty terms, and operational timing can prevent a textbook payoff.
Shared risk factors
Two securities may respond to the same industry, issuer, curve, commodity, currency, or macro factor. The hedge ratio should be expressed in the risk unit that matters, such as duration, beta, delta, or another sensitivity, rather than assuming equal cash amounts create an equal hedge.
Capital-structure relationships
Debt, equity, preferred securities, convertibles, and credit derivatives issued around the same company can embed related views of enterprise value, volatility, recovery, and default risk. The relationship is real, but each instrument can react differently to liquidity, optionality, covenants, and corporate actions.
Statistical relationships
A statistical model may identify a stable residual after controlling for common factors. The model still needs an economic explanation and a regime-break test. Without them, the trade can become a bet that a historical pattern will repeat simply because it has repeated before.
How do you build a relative value trade?
A reviewable trade package should make the idea reproducible by someone other than its author. The package does not need to expose proprietary code to every reviewer, but it should reveal enough about data, assumptions, sizing, costs, risks, and controls for an independent challenge.
| Decision | Required evidence | Review question |
|---|---|---|
| Universe | Eligibility, liquidity, borrow, and instrument terms | Can both legs actually be traded and maintained? |
| Relationship | Economic rationale and model specification | Why should this spread behave as expected? |
| Sizing | Hedge ratio and residual risk decomposition | What exposure remains after the hedge? |
| Economics | Expected convergence, carry, financing, and costs | Is the expected edge positive after realistic friction? |
| Failure plan | Stops, limits, scenario losses, and escalation path | What forces a reduction or exit? |
| Operations | Execution, settlement, collateral, and monitoring owners | Can the team control the trade throughout its life? |
Position sizing should start from a loss budget and stress behavior, not from the amount of capital available. Analysts should model a wider spread, a slower convergence path, higher borrow and financing costs, weaker liquidity, a margin increase, and a failed catalyst. If the trade only works under the base case, the apparent edge is too fragile.
The operating process matters because a good model can still fail through stale data, incorrect instrument mapping, mismatched quantities, missed corporate actions, or an approval that does not match the executed order. Teams that run multiple strategies can use a controlled hedge fund risk management process to make those checks explicit.
What does a relative value arbitrage example look like?
Consider two bonds from the same issuer with similar seniority but different maturities. After adjusting for duration, curve exposure, liquidity, and expected cash flows, the analyst concludes that one bond is cheap relative to the other. The proposed trade buys the cheap bond and sells the rich bond in risk-matched amounts.
The expected return is not simply the current yield difference. The analyst builds a bridge from the opening spread to the expected exit spread, then adds coupon carry and subtracts repo, borrow, transaction, and hedging costs. The risk case assumes the spread widens, financing becomes more expensive, or the short leg becomes harder to borrow.
A complete decision record states the expected holding period, the catalyst or mechanism for convergence, the maximum tolerated spread, the liquidity available on both legs, and what happens if only one leg can be executed or exited. It also explains whether the position would still make sense if the expected catalyst is delayed.
Which relative value strategies are common?
Equity pairs and statistical arbitrage
Equity pairs trades buy one stock and short another, often after controlling for sector, style, or market factors. Broader statistical arbitrage portfolios apply the same relative logic across many positions. The central challenge is distinguishing a temporary residual from a genuine change in fundamentals or factor exposure.
Fixed-income curve and spread trades
Fixed-income relative value can compare neighboring maturities, similar issuers, cash bonds and derivatives, or securities with related credit and optionality. Duration, convexity, curve shape, liquidity, financing, and collateral terms can all matter as much as the quoted spread.
Treasury cash-futures basis
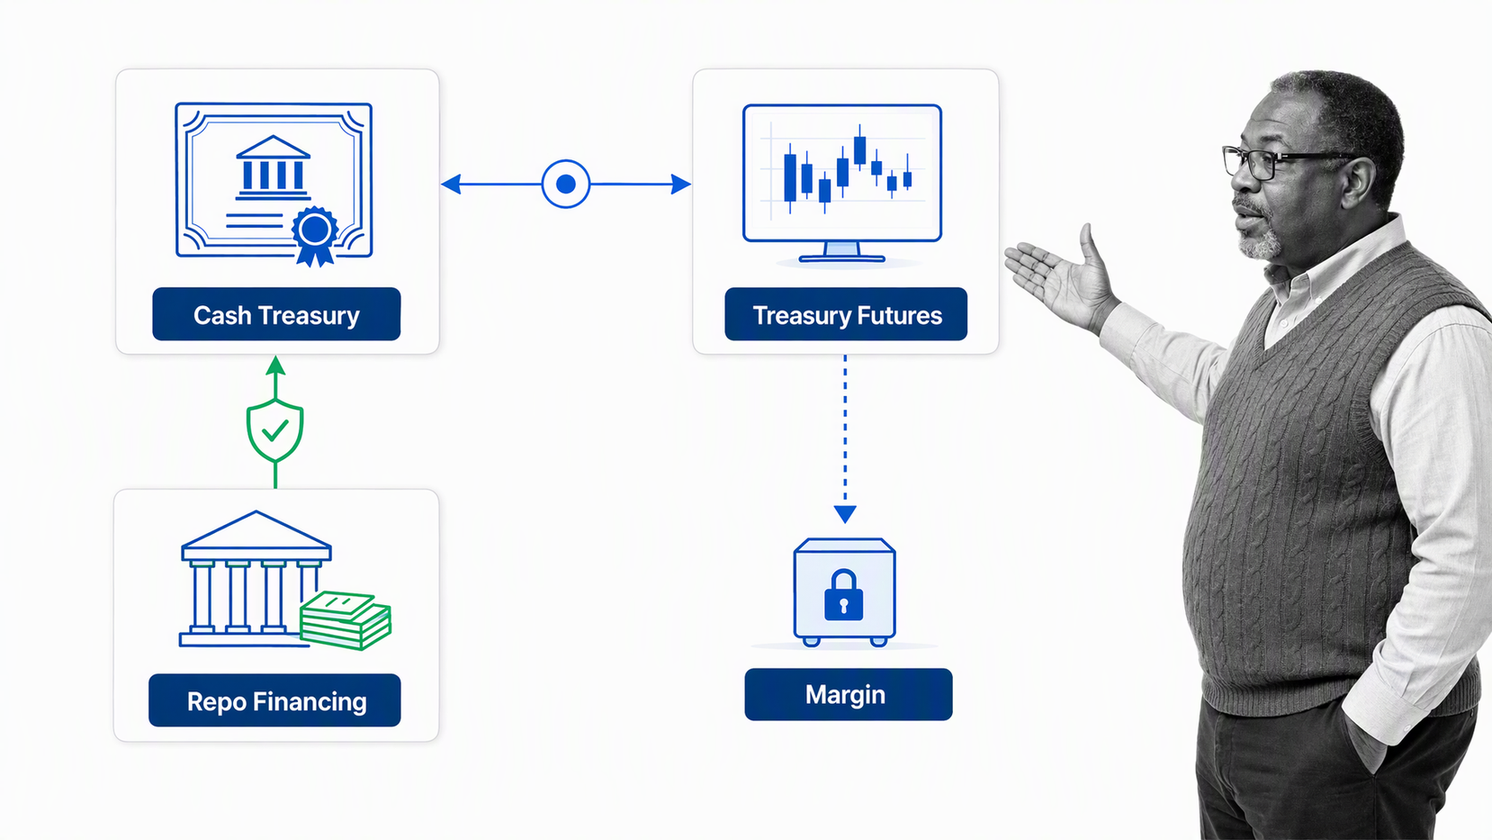
A Treasury basis trade links a cash Treasury position, Treasury futures, and repo financing. Federal Reserve research notes that this activity can support price discovery and liquidity, while also creating financial-stability concerns because exposures span cash, futures, and repo markets and can involve high leverage. The Federal Reserve analysis of Treasury exposures is a useful reminder that a small basis does not imply a small balance-sheet or funding risk.
Convertible arbitrage
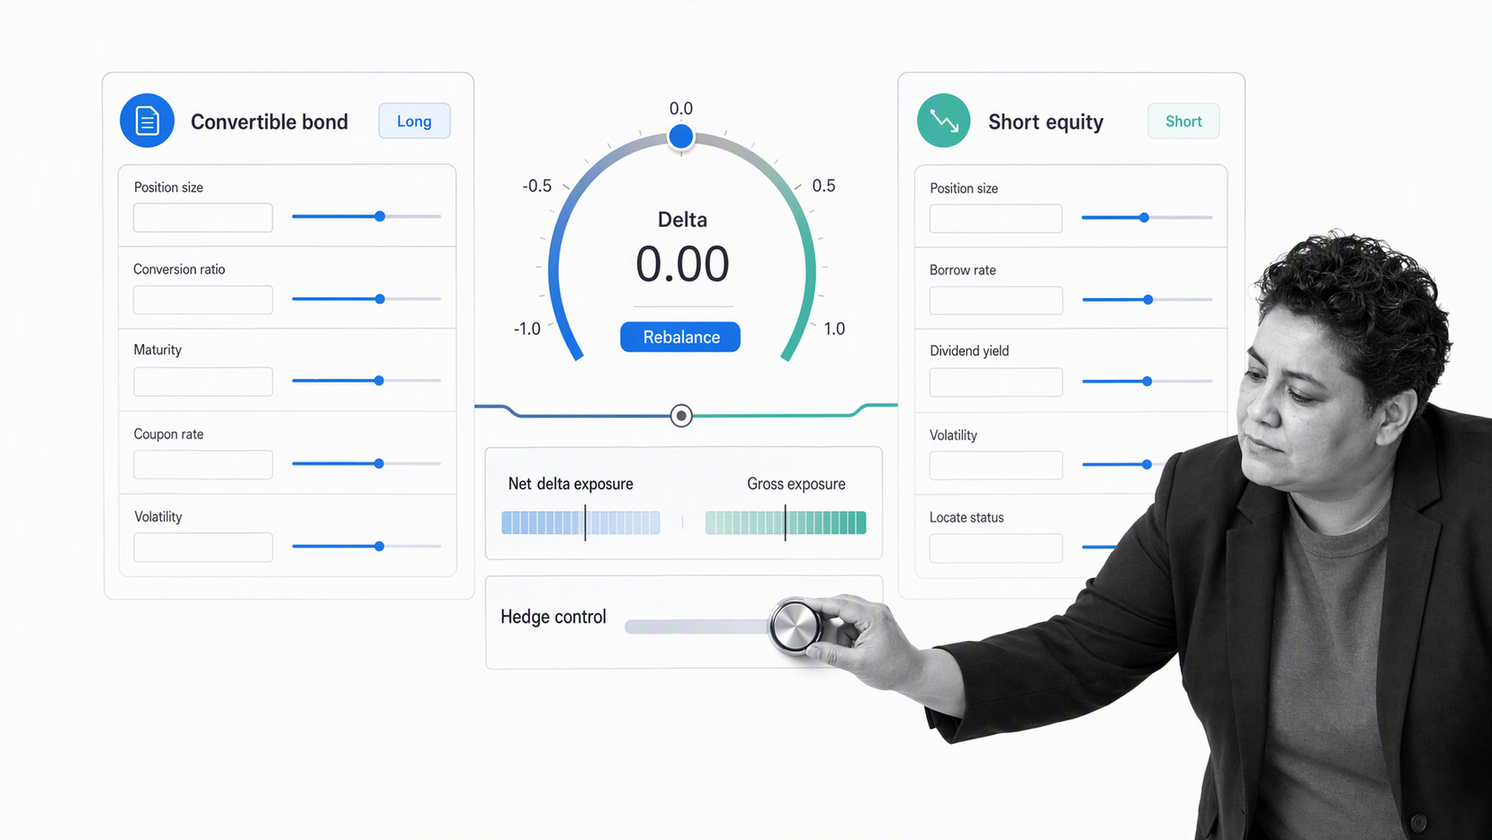
Convertible arbitrage often buys a convertible security and hedges part of the equity exposure by shorting the underlying stock. Credit, rates, volatility, conversion terms, borrow availability, dividends, and corporate events affect the result. The hedge may need to change as the underlying price and option sensitivities move.
Capital-structure and credit relative value
These trades compare securities within or across issuer capital structures. A manager might express a view through bonds, loans, equity, preferred securities, or credit derivatives. Documentation and recovery assumptions matter because two instruments that reference one issuer can have very different legal and economic outcomes.
Volatility relative value
Volatility trades compare implied or realized volatility across strikes, maturities, underlyings, or related option structures. Delta, gamma, vega, skew, correlation, transaction costs, and rebalancing rules can create exposures that are not obvious from the opening position.
What are the main risks of relative value arbitrage?
The defining danger is that a trade designed to look balanced in normal conditions can become one-sided under stress. Correlations change, liquidity becomes asymmetric, margin requirements rise, and several funds may try to reduce the same crowded position at once.
| Risk | Failure mode | Useful control |
|---|---|---|
| Model risk | The estimated relationship or hedge ratio is wrong | Independent validation and regime tests |
| Basis risk | The instruments do not offset as expected | Sensitivity decomposition and residual limits |
| Liquidity risk | One leg cannot be traded near the modeled price | Leg-level liquidity tests and exit scenarios |
| Funding risk | Repo, borrow, or collateral terms change | Funding tenor, counterparty, and margin stress |
| Leverage risk | A small spread move creates a large capital loss | Gross exposure and stress-loss limits |
| Execution risk | Legs fill at different times or sizes | Order protocol, slippage bounds, and kill switch |
| Crowding risk | Many traders exit the same position together | Crowding indicators and concentration limits |
| Event risk | A corporate or policy event changes the relationship | Event calendar, escalation, and thesis review |
Federal Reserve research on repo and margining explains how low haircuts and futures margins can support substantial leverage in Treasury relative value trades. Its discussion of repo, leverage, and margining shows why funding terms belong inside the trade thesis rather than in a separate operations appendix.
Short positions add their own mechanics. Investor.gov explains that a short sale involves selling borrowed stock and later buying stock to return it, with the investor responsible for interest, loan charges, and dividends paid while the position is open. Its short-sales overview also highlights the possibility of theoretically unlimited loss when a stock price rises.
Which controls should an investment team use?
Controls should follow the position across its life. A one-time approval cannot manage a trade whose sensitivities, borrow, margin, and liquidity change every day.
- Research controls: approved data, reproducible analysis, model ownership, version history, and independent challenge.
- Pre-trade controls: eligibility, restricted-list checks, borrow confirmation, liquidity, concentration, stress loss, and authority limits.
- Execution controls: instrument identity, side, quantity, hedge ratio, order sequence, slippage bounds, and failed-leg escalation.
- Daily controls: spread, residual sensitivities, gross and net exposure, financing, margin, collateral, borrow, liquidity, and events.
- Exception controls: named owner, severity, deadline, interim limit, approval path, and evidence of resolution.
- Exit controls: target, stop, time limit, catalyst outcome, thesis break, liquidity deterioration, and funding trigger.
- Post-trade controls: attribution, model-versus-realized comparison, operational incidents, and rule changes before reuse.
Limits should be specific enough to trigger action. A dashboard that shows a red indicator without an owner, escalation path, or deadline does not control risk. The workflow should define who can approve an exception, how long it remains valid, and which conditions force position reduction.
How can a team govern research and execution?
Relative value strategies join quantitative research, portfolio management, risk, trading, operations, legal, compliance, finance, and technology. The handoffs between those groups are part of the risk model. A controlled workflow turns each handoff into an assigned decision with required evidence.
Process Street can coordinate that operating layer while market data, portfolio, order, and accounting platforms remain authoritative. Teams can route a proposal through research review, risk challenge, trade-readiness checks, approval, recurring monitoring, exception handling, and post-trade review. This is one practical application of financial process automation: specialist judgment stays with the right people, while required steps, evidence, and decisions stay connected.
| Workflow stage | Owner | Evidence captured |
|---|---|---|
| Idea intake | Research | Relationship, catalyst, universe, and initial data |
| Model review | Independent reviewer | Specification, validation, costs, and limitations |
| Risk review | Risk | Residual exposures, stress cases, limits, and exceptions |
| Trade readiness | Trading and operations | Borrow, liquidity, settlement, margin, and order plan |
| Approval | Delegated authority | Decision, conditions, sizing cap, and expiry |
| Monitoring | Portfolio and risk | Spread, exposures, funding, events, and breaches |
| Close and learn | Cross-functional review | Attribution, incidents, lessons, and control changes |
The result should be a decision trail, not a paperwork trail. Reviewers need the current thesis, model version, open risks, approvals, and exceptions in one sequence. When the market changes, the workflow should reopen the relevant decision rather than allowing an outdated approval to follow the trade indefinitely.
When should a relative value position be closed?
A position can close because the spread reaches its target, the expected catalyst occurs, the time limit expires, the thesis breaks, a risk limit is breached, financing changes, liquidity deteriorates, or the expected return falls below the cost and risk of holding the trade.
A profitable position can still deserve criticism if it violated limits or depended on an unplanned exposure. A losing position can still reflect a sound process if the loss stayed within the approved scenario and the team exited when its invalidation rule fired. Post-trade review should separate investment outcome from decision quality, then feed the findings into the next research and approval cycle.
Relative value arbitrage FAQs
Is relative value arbitrage risk-free?
No. Most relative value positions are convergence trades between similar rather than identical instruments. They retain basis, model, liquidity, funding, execution, counterparty, and tail risks even when their intended net market exposure is small.
What is the difference between relative value arbitrage and directional trading?
Directional trading depends mainly on an asset rising or falling. Relative value arbitrage focuses on the changing relationship between two or more linked instruments, usually through offsetting long and short positions. Imperfect hedges can still leave directional exposure.
What is pairs trading?
Pairs trading is a relative value approach that takes opposing positions in two related securities and seeks to profit if their spread returns toward an expected relationship. A credible design needs an economic rationale, a stable hedge ratio, trading-cost assumptions, and exit rules.
Why is leverage common in relative value strategies?
The expected spread change may be small, so managers may use borrowed financing or derivatives to increase the position’s economic exposure. Leverage also magnifies losses, margin calls, and the chance that a position must be closed before convergence occurs.
How do traders know when a spread should converge?
They define a relationship using cash flows, capital structure, contractual conversion, deliverability, historical behavior, or another defensible economic link. They then test what could break that relationship and define a time horizon, catalysts, invalidation conditions, and exit thresholds.
How can Process Street support a relative value investment workflow?
Process Street can coordinate research intake, model review, risk approval, trade-readiness checks, exception routing, recurring monitoring, and post-trade review. The workflow can assign owners, collect evidence, preserve approvals, and create an auditable operating record around specialist market and execution systems.