
Unified Modeling Language (UML) is a way of visualizing a software program using a collection of diagrams. That is one of the simplest ways to define it.
In equally simple terms, it is a modeling language used to analyze, design and implement software-based systems.
However, UML diagrams can be applied to more than just software engineering and development.
There are over a dozen types of UML diagrams that are used for a range of different purposes and have significant variances in complexity.
One of the simplest types, which also happens to be the most suitable diagram for modeling business processes, is called the activity diagram.
This is the diagram we will be focusing most of our attention on in this post, though we will take a quick look at some of the other common types for the sake of context and because you may also find them useful beyond the purpose of process modeling & optimization.
As I mentioned in my UML tutorial, although the language has many advantages including flexibility, an abundance of tools, and the capacity to model systems from both a structural and behavioral perspective, it can be overwhelming due to the sheer complexity and range of capability that is offers.
“UML specification is a huge book (732 pages), the UML metamodel is large and quite complex, and the definition and the understanding of its static and dynamic semantics is a truly difficult task, with also the consequence to make difficult to teach it both at the school/university level or in the industry (Grossman et al., 2005).” – What Are the Used Activity Diagram Constructs?
Despite its complexity, UML does not need to be leveraged in a complicated fashion for it to be useful. In fact, one of the men who created the language believes it should be used rather casually.
“Seriously, you need about 20% of the UML to do 80% of the kind of design you might want to do in a project – agile or not – but use the UML with a very light touch: use the notation to reason about a system, to communicate your intent to others…and then throw away most of your diagrams.” – Grady Booch
So it is important to keep things as simple as possible if you want to model actionable diagrams that can be internalized by your team and evaluated accurately by managers for effective process optimization.
Let’s now go into a brief history of UML, look at the various types of diagrams, provide a step-by-step guide to creating activity diagrams and guidance on how they can be used to optimize processes and improve team performance.
The Three Amigos: A brief history of UML
The seeds for a modeling language like UML were being planted way back in the 1960s, when Norweigan computer scientists Ole-Johan Dahl and Kristen Nygaard developed what is generally acknowledged to be the first object-oriented language, Simula-67. This language never had a large following but sparked major inspiration for later languages.
During the 1980s, software engineers were becoming increasingly keen to establish a simplified and more consistent way to model systems, and object-oriented programming languages grew increasingly complex.
Between 1989 and 1994, the number of object-oriented methods increased from fewer than 10 to more than 50.
Ideas really started to materialize in the mid 1990s when Grady Booch, James Rumbaugh, and Ivar Jacobson began to consolidate ideas from each other’s methods, and set out to create a unified modeling language that would allow software engineers to evolve together rather than working on different languages, bring stability to the object-oriented marketplace, and encourage collaboration that would yield further improvements to the language for all users.

The UML effort started officially in October 1994, with the version 0.8 draft being released in October 1995. The Three Amigos, as they are sometimes referred to (Booch, Rumbauch, and Jacobson) had successfully unified semantics and notation, ultimately meaning that users could focus on their own work and worry less about the specifics of a given method.
Throughout the next decade, the language continued to develop, and it soon became clear that several industry-leading organizations including Microsoft, Oracle, and IBM saw UML as critical to their own business development.
From 2000 to 2003, a new and expanded set of partners produced an updated specification of UML, version 2.0. This was officially adopted by the Object Management Group (OMG) in 2005, and is a major revision of UML 1 that includes a large number of additional features.
The most important takeaway when considering the history of UML is that it is the work of a large number of individuals over the course of many decades. Once a fragmented area of software development that had over 50 methods developed by different engineers, the three amigos were able to consolidate them into a unified language that is still being improved and continues to be a critical method for both software and process modeling in the enterprise community.
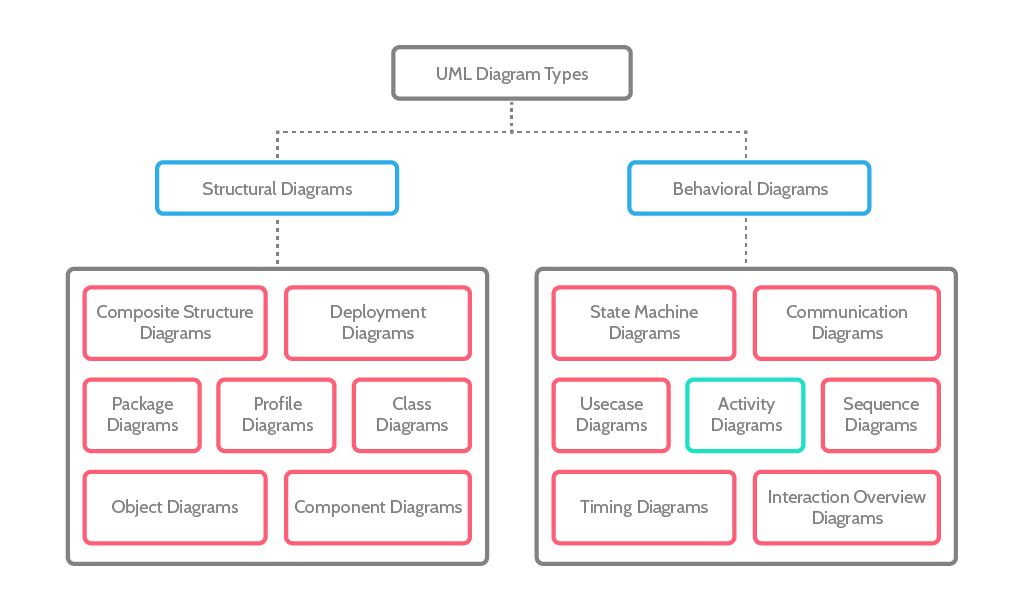
A quick look at the 2 broad types of UML diagrams
Structural diagrams
Structural diagrams are for representing the static aspect of the software system. As the name suggests, they are designed to illustrate the system’s underlying structure. The 4 main types of structural diagrams are:
- Class Diagram
- Object Diagram
- Component Diagram
- Deployment Diagram
By far the most commonly used is the class diagram. From a software development perspective, it is one of the most useful UML diagram types because it clearly maps out the structure of a system by modeling its classes, attributes, operations, and relationships between objects.
Below is an example of a class diagram for a hotel management system.
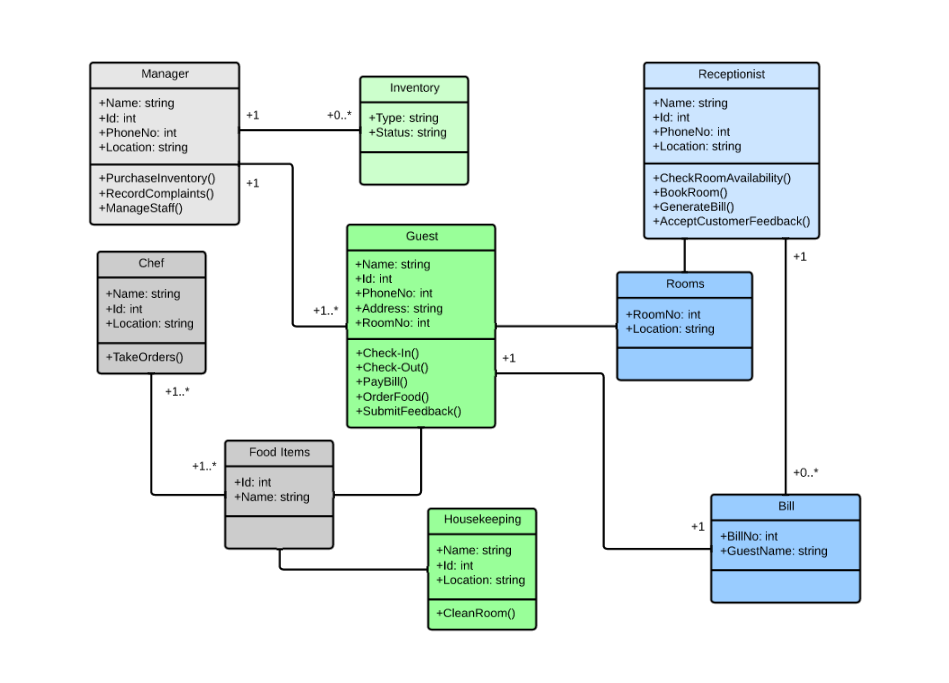
In other words, it provides both a detailed insight and a quick, big-picture overview of a system’s structure, making it the most widely used diagram at the time of system construction.
Behavioral diagrams
Behavioral diagrams, on the other hand, visualize, specify, construct, and document the dynamic aspects of a system.
The 5 types of behavioral diagrams are:
- Use Case Diagram
- Sequence Diagram
- Collaboration Diagram
- Statechart Diagram
- Activity Diagram
A use case diagram is designed to demonstrate how users might interact with a system. Users (also known as actors) include people, organizations, or external systems. Use case diagrams are not intended to be complicated, but rather to give a clear picture of how users are interacting with a particular system and whether or not those interactions are happening as intended.
Sequence diagrams are used to show how objects communicate and in what sequential order. They are perhaps the most commonly used interaction diagram.
Activity diagrams are also very popular, and are just what we need for modeling business processes because they are the only type of UML diagram that accounts for the flow of actions.
Why activity diagrams are the most suitable for process modeling
Business process modeling is the act of documenting the series of steps and actions taken within a business process. This involves:
- Identifying the actors involved and the roles they play in the process
- Showing how the actors interact with each other through the progression of various activities
- Providing a clear picture of the journey it takes through the organization
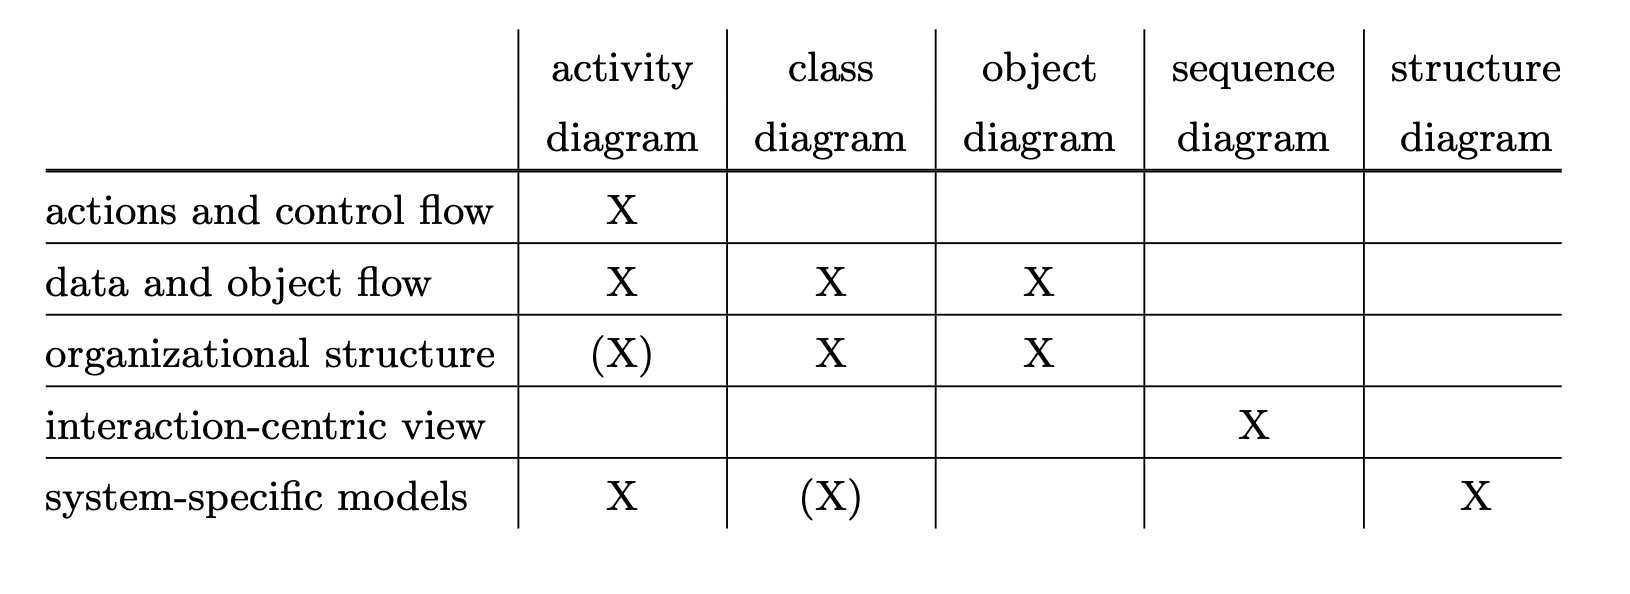
The activity diagram, also known as a swim-lane diagram or cross-functional flowchart, describes how a set of activities are coordinated to provide a service.
It is the most suitable diagram for business process modeling as it neatly illustrates the flow of a process from activity to activity. It is essentially an advanced version of a flow chart, making it an ideal tool to represent all kinds of business workflows.
3 main benefits of activity diagrams
- Activity diagrams are generally far less complicated than other UML diagrams, making them easier for both analysts and stakeholders to fully comprehend.
- They allow an analyst to display multiple conditions and actors within a workflow through the use of swimlanes.
- They have the ability to clearly describe the steps performed in a UML use case.
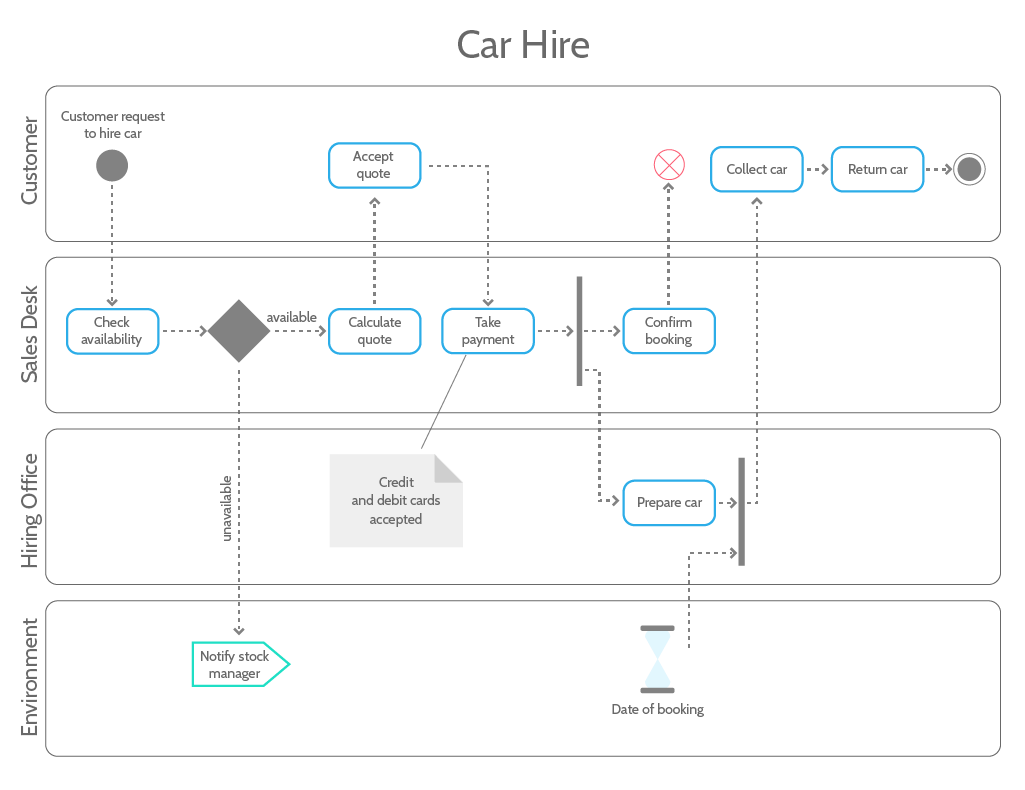
Below is an example of an activity diagram illustrating a typical process for hiring a car. For a 10-step guide to completing a simple activity diagram like this one, check out my tutorial.
Overview of the basic components
- Start node: Symbolizes the beginning of the activity, represented by a black circle.
Action: A step in the activity wherein the users or software perform a given task, represented by a rectangle usually with rounded edges - Decision node: A conditional branch in the flow that is represented by a diamond shape. It includes a single input and two or more outputs
- Control flows: The connectors that show the flow between steps. These include connector arrows, the join symbol, and the fork symbol
- End node: Symbolizes the end state of an activity and represents the completion of the process.
Make your activity diagrams actionable
A recent study found that just below 20% of completed activity diagrams are actually used.
Once they have been created and reviewed by software engineers and senior management, activity diagrams often fail to be applied to improving current processes. But why waste your time and energy creating a model that ultimately has no impact on business performance?
With a simple business process management tool like Process Street, you can implement your UML diagrams by instilling the process in a checklist. We have hundreds of pre-made templates to choose from to help you get started.
How the activity diagram can be used for optimizing business processes
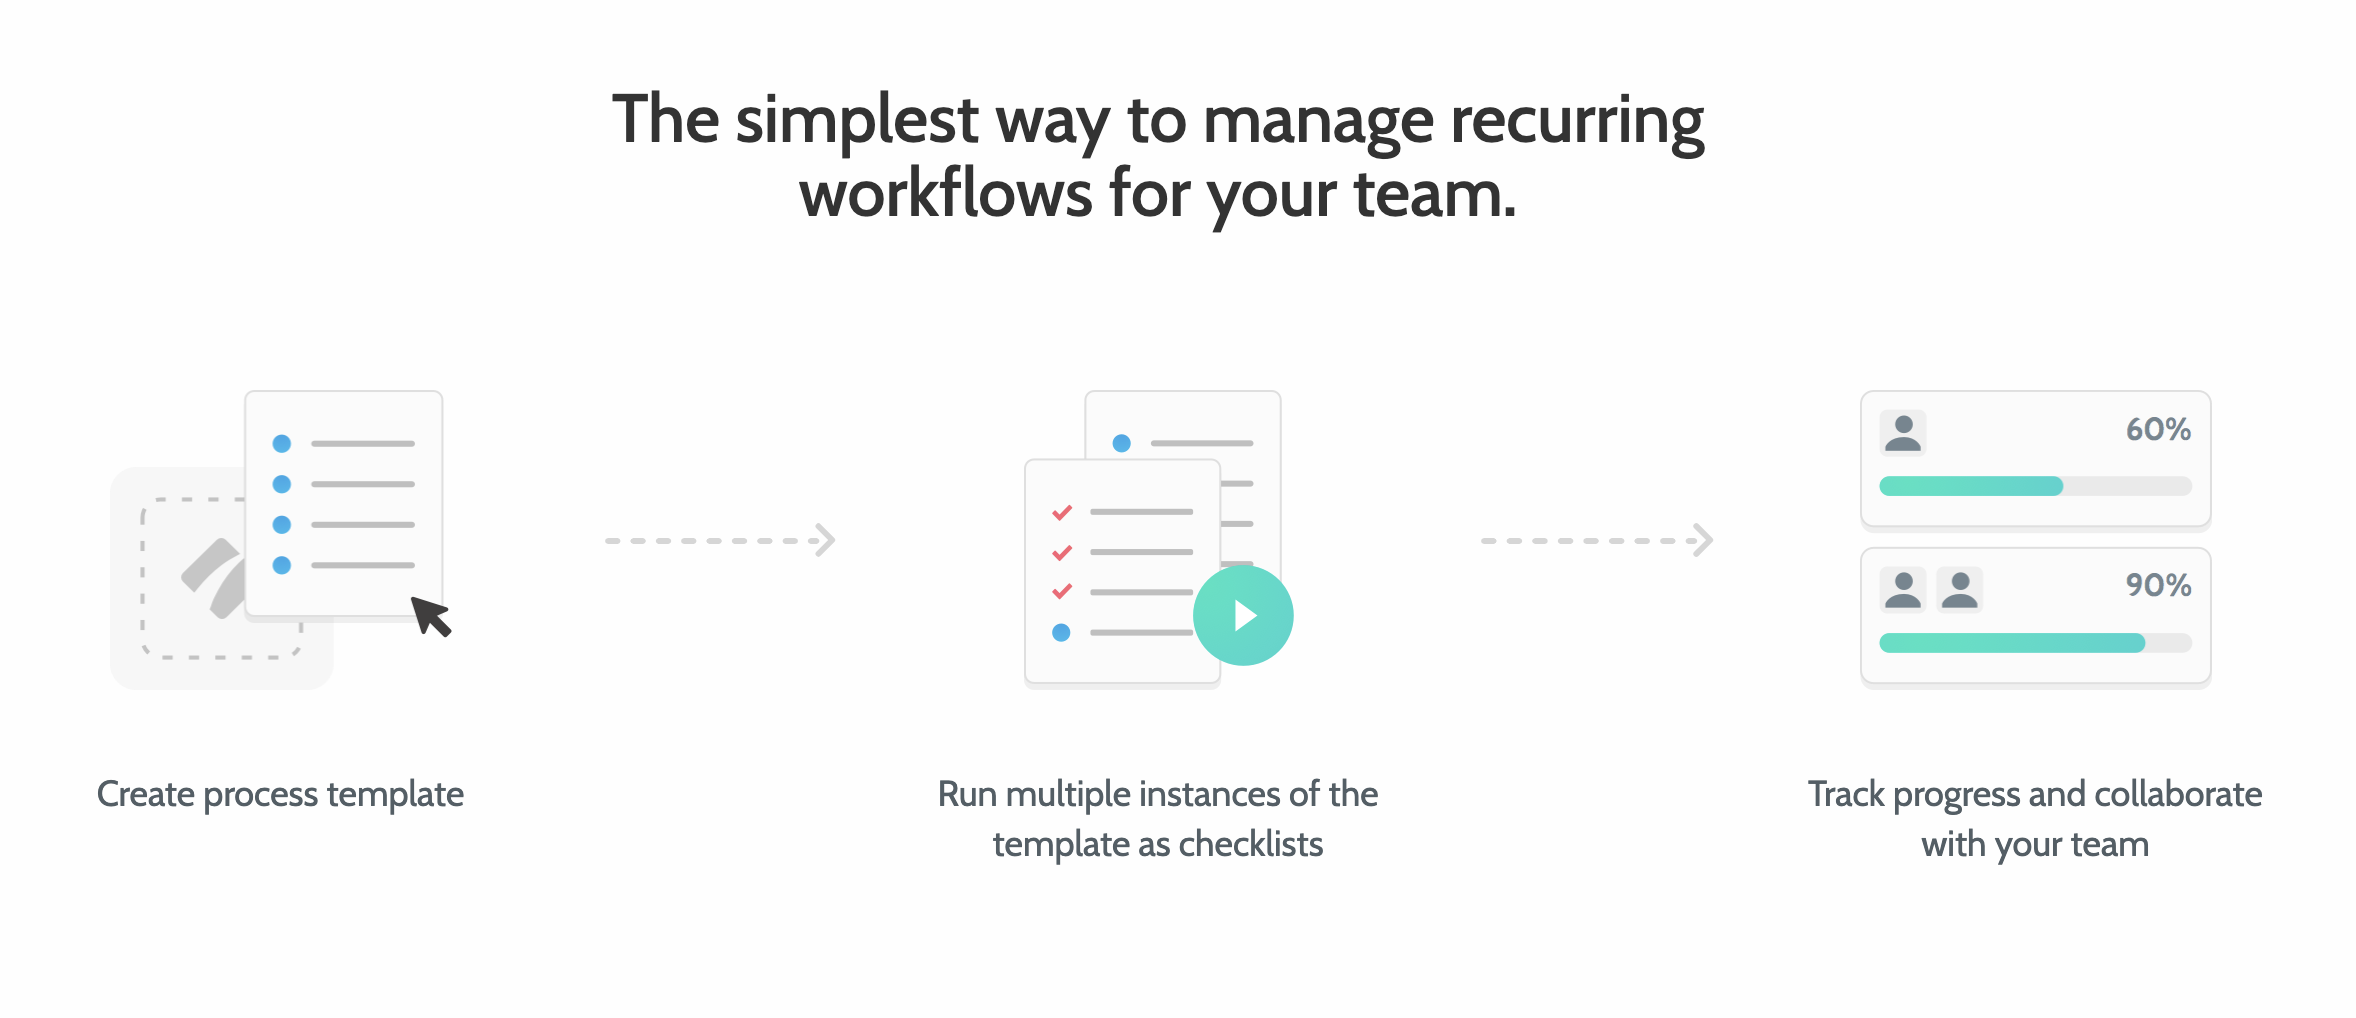
Process Street’s workflow software enables you to easily convert your UML activity diagrams into actionable checklists.
By documenting your workflows in digital checklists, you are instantly creating an actionable workflow in which tasks can be assigned to team members, automated, and monitored in real-time to ensure they are being executed as intended, each and every time.
You can also connect your checklists with other tools in your tech stack through our Zapier integration which connects Process Street with over 1000 other applications.
One of the most important components of an activity diagram is the decision node, and Process Street offers an ideal feature to account for decisions made as your team progress through a checklist.
It’s called conditional logic, and with it you can create truly dynamic checklists that adapt to the unique needs and circumstances of your organization.
As various decisions are made throughout the progress of a certain workflow, the checklist will automatically adapt to the situation and present only relevant tasks.
In the context of UML, when a decision node in your activity diagram is reached, the process will branch out to different activities (tasks) depending on which decision is made.
So, once you’ve got the diagram embedded in a checklist that is being utilized by your team, managers can begin to monitor performance more closely and identify opportunities for process optimization.
However, although process optimization initiatives may seem like a project reserved for managers, it is absolutely essential that employees following the process on a daily basis are involved in the decision-making process when it comes to evaluating and improving workflows.
Involve your employees in process optimization initiatives
According to Salesforce research, employees who feel their voice is heard are 4.6 times more likely to feel empowered to perform their best work, while another study indicates that organizations with high employee engagement outperform those with low employee engagement by 202%.

As I mentioned in my article on involving employees in process design, the following points are my top tips for creating a collaborative working environment that yields quality results and maintains a high level of morale throughout the team.
- Instill a culture of open and honest communication through attentive, personalized onboarding.
- Provide channels for employees to easily voice suggestions and concerns by integrating various tools like Slack and your CRM.
- Utilize a variety of communication vehicles beyond email to show the benefit of being involved.
- Identify process improvement champions and empower them to encourage contribution from other employees.
- Recognize that all input is valuable and should be considered with equal care and attention.
- Be a good leader who makes employees feel comfortable, trusted, and valued.
Once you’ve established a solid method for involving your employees and discussing ways to optimize processes, there are a few key questions that should be addressed every time a process is formally reviewed. From a managerial perspective, these questions should be considered every day while overseeing performance.
- What part(s) of the process is causing inefficiency?
- Which aspects of the process work really well?
- Is the process flexible enough to adapt to unforeseen changes?
- What kind of iterations would improve user adoption?
By discussing these simple questions with team members on a regular basis and formulating clear action items to make adjustments, processes can be continuously optimized so it is well understood by all users and produces the best results possible.
We also have a handy checklist for recording process optimization initiatives that you can immediately add to your checklist library and start using today.
Let me know how you think UML diagrams, in particular the activity diagram, can be best applied to modeling and optimizing business processes. What steps do you and your team take to make sure processes are being executed as efficiently as possible?


Alex Gallia
Alex is a content writer at Process Street who enjoys traveling, reading, meditating, and is almost always listening to jazz or techno. You can find him on LinkedIn here