It’s no secret that documenting and analyzing your business processes is vital to creating a healthy business.
Yet, despite the benefits of bpm software and business process mapping being readily talked about, value stream mapping doesn’t get the same share of attention.
This is a mistake.
Value stream mapping is just as, if not more, important to reducing waste and increasing your business’ efficiency than standard process mapping.
That’s why I’ll be showing you how to make a value stream map from start to finish, with no wasted time and no needlessly confusing terms.
Let’s go.
What is value stream mapping?
I hate jargon. I also hate business terms which are often labeled “jargon” because barely anyone explains why they’re useful without exhausting the lexicon to try and sound important.
Value stream mapping is vital but not mystical or complicated.
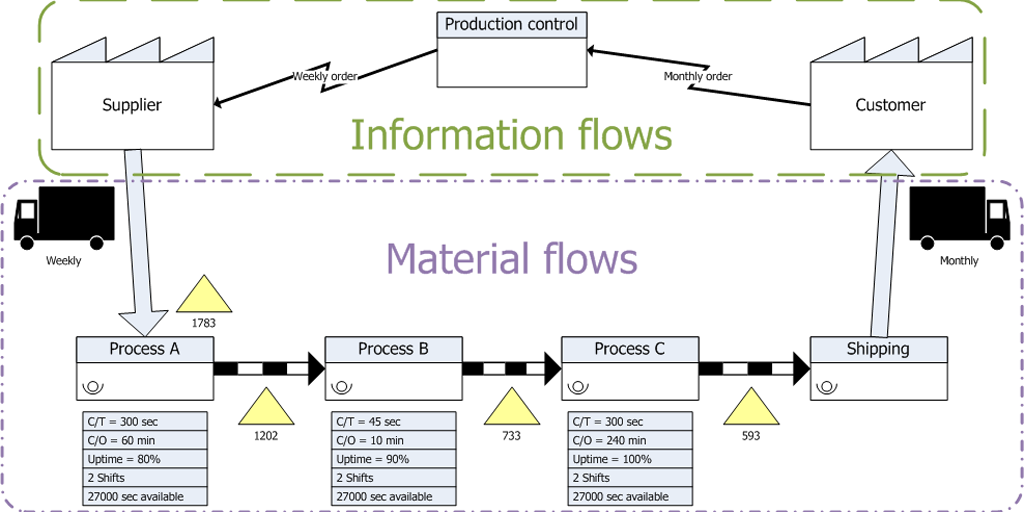
A value stream map is a diagram of the stages one of your products goes through from the moment you get the materials to make it to the point where you hand it off to your customers.
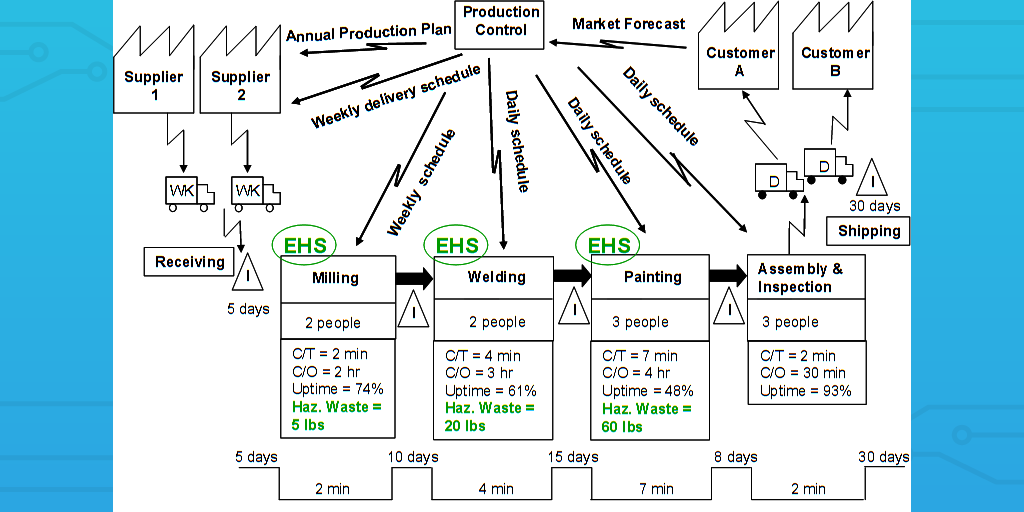
This diagram shows the flow of the product through your workstations and records up-to-date figures for things such as the standing inventory at every stage, how long your product is actually being worked on, and the total time it takes for your product to go through the whole system.

It’s not designed to tell you exactly what goes on in your business’ processes. That’s what business process mapping is for.
Instead, with these figures applied to the general flow of a product through your facility, it becomes possible to easily find and eliminate the largest points of waste in your processes.
One of the best things about this model is that it doesn’t necessarily matter where your team is located or even if you’re working with a remote team – as long as you can get the bare bones information sorted, you’ll be able to analyze your processes for waste using this method.
Enough of me rambling – let’s get into how to make a value stream map!
Select the product and scope
First, you need to choose which product (or product family) you’re analyzing. The specific product doesn’t matter much, as you should be doing value stream mapping for everything you’re making or providing for customers.
However, if this is the first value stream map you’re creating then it’s best to select the product which either has the highest volume or is the most valuable. That way you’re analyzing the waste for the most important product for your company’s income stream.
Once you’ve selected a product, you then need to define the scope of the value stream map. That is, where the map starts and ends.
The easiest way to do this is to go from the point where you receive your products (or raw materials) from your suppliers and end with handing off the product to your customers.
It is possible to create a map for the entire process from start to finish if there are more suppliers before or after you in the product’s journey from materials to final customers.
However, if you’re going to map the entire process then you’ll want to use generic symbols for companies for the processes that aren’t related to a system you can control. That way you don’t need to know how they conduct their business to create an accurate map – you just need to know how long it takes to get from the raw supplies to your own side.
Alternatively, you could use the boxes that are usually reserved for the process stages in your business to represent companies for the various stages of the product’s cycle (including your own).
That way there’s a consistent scale to what the boxes represent and you should be able to identify where in the chain the most waste is being generated. In turn, this could allow you to identify whether it’s more realistic and advantageous to improve your end of the process or to search for a different supplier (or other company in a different part of the chain).
To keep things simple for this example, let’s say that you’re just plotting the value stream map for the product in reference to your own company. This means that you start with receiving materials from your suppliers and end with handing off the product to your customers.
Create the process map

Now it’s time to create the rough process map. This means that you need to separate the various stages that the product goes through in your business before being sold.
Here’s where value stream mapping differs from regular business process mapping.
For the value stream you shouldn’t be recording every task that’s performed on the product, as you’re not analyzing the efficiency of your own processes (at least, not directly).
Instead, the process stages should be separated into the various workstations that the product stops at for work to be performed.
For example, if you’re baking a cake then the process steps would be something like:
- Supplier
- Logistics to your facility (with frequency of deliveries, eg, weekly)
- Mixing
- Oven
- Filling
- Cutting
- Icing
- Decorating
- Quality control
- Packaging
- Shipping to customers (with frequency of deliveries, eg, daily)
- Customer
This means that you don’t need to have any fancy flowcharts for the different kinds of process stages, as we’re more interested in the workstations themselves and the amount of time the product spends at (and between) each of them.
For that reason, each station can be labeled in separate boxes with arrows showing the flow of the product through them. If one station is used several times throughout the process, separate boxes should still be created to represent the different stages of work that the product goes through.
Record the information flow
Next, is to show the flow of key information between you, your customers, and your suppliers in terms of the product.
This means knowing and recording how the customers order your product, how many and how often they order, and how you meet those demands via your communication with the supplier.
For example, if your customers buy the product in store, this would count as a daily order (they order the same day they pick up) and an average can be calculated for what you’ll need for each day to meet that target.
As for your supplier, the same rules apply – record how often you put an order in with the supplier and what forecast you’ll want to have for the number of products you’ll need.
The final part of this step is to show how you communicate your needs to the various stations involved in creating the product. These don’t need to be explained but it’s useful to know how often you’re touching base with each of these stations. E.g. you can create a box with “weekly (or monthly) schedule” inside it and draw arrows from that schedule to each of the stations that are kept on that kind of rota.
To show this on your value stream map, create a box in the top center of your diagram and label it “production control”. From here, draw and label:
- Two arrows from the customer to production control (one for how often orders are made, one for how long your product forecast is)
- Two arrows from production control to your suppliers (one for how often orders are made, one for how long your material forecast is)
- Arrow to boxes for the schedules for various workstations (eg, a daily schedule box, a weekly schedule box, etc)
- Arrows from your schedule boxes to the workstations that run on those schedules
Measure and record current results

Now that you’ve got the basics of value stream mapping down it’s time to dive into the specifics of your current setup and record key information on its performance.
This usually means taking note of:
- Inventory numbers
- Cycle time
- Changeover time
- Up-time
- Employee/operator numbers
- Shifts worked
- Net available working time
- Scrap rate
- Pack size/pallet sizes
- Batch Size
Most of these factors are self-explanatory but the key here is to make sure that you’re not taking any figures for granted and that you’re recording them accurately for every step of the process that you’ve outlined.
For example, inventory is something that’s easy to count in theory but in practice is far messier. Pallets and items can often be stored in odd, out-of-the-way places for the sake of ease in the spur of the moment, which leads to a huge amount of waste.
This is exactly the kind of thing that value stream mapping will cut down on so don’t ignore it. If there’s floating inventory, it still counts as inventory.
Cycle and changeover time are as per usual; the cycle is how long it takes to make one product (in that stage of the process) and the changeover time is how long it takes to get started on the next item.
Everything else is exactly what it sounds like, from up-time being the % of work time that the system is up and running for to the scrap rate being the rate at which the process fails to create a satisfactory product.
Once you know these factors, record them underneath your current value stream map, lining up your data sets to show which stage of the process they’re referring to. I.e., put the “oven” data below the “oven” stage, and so on.
Make a timeline
Next you need to calculate a timeline for the product as it moves through the various stages of the process. This needs to be split into two segments:
- The amount of time between each process stage
- The cycle time for each stage of the process
These then need to be arranged on the value stream map in a way that makes it clear which time values correspond to each cycle time and the time between your process stages.
Then, at the end of the process line, you should be able to easily calculate two values:
- The total lead time (amount of time for the full process – cycle time + time between stages)
- The total cycle time (amount of time the product is actually being worked on)
The total lead time can be rounded to an appropriate unit (eg, 1 day) and the overall timeline plays a vital role in showing how much time is wasted on the product where there is no work being performed on the process.
Analyzing the value stream map

You’ve set up the value stream map – congratulations! Now it’s time to dive in and analyze it.
With the figures and timeline you’ve recorded you should be able to see where the largest areas of waste lie in your product flow. This can be anything from excess floating inventory to inefficient cycle times.
One common point of waste is the disparity between your overall lead time and the cycle time for your product. The bigger the difference, the more time is being wasted where your product is sitting there and not being worked on.
This is usually down to the travel time between workstations being far too long.
Let’s say that you’ve got three stages that your product needs to go through before it’s finished and shipped to your customers. Most of us would initially think of arranging this by having three separate workstations and moving the product from one place to the next when each piece of work is done.
My own equivalent would be writing a post on one computer, swapping to another in a different building to do the editing, and then to yet another to insert the images, and so on. Not only would that kill my writing workflow, it’s a needless waste of time when I could just combine my workstations into a single location (even if I still need to change to a different computer).
This is where theories like one piece flow demonstrate how inefficient that setup is.
It’s much more efficient to instead have your workstations as close to each other as possible to make the handoff between them seamless. That way there’s no chance of your workstations being left idle while waiting for the next item to arrive.
Basically, if the travel time between workstations doesn’t equal the cycle time of the following workstation (relative to the number of products being worked on and transferred at a time) you’re wasting time.
Once your lead times more reasonably resemble your cycle times you can start to analyze for and solved other common waste problems, such as floating or excessive inventory (at any stage).
You don’t need high-tech value stream mapping to be effective
While software like Lucidchart, SmartDraw, and other flowchart apps exist and can be used fairly comfortably to create a value stream map, there’s no real need to do so unless you’re either a large company with tens or hundreds of product to analyze or your value stream is so complex that pen and paper won’t cut it.
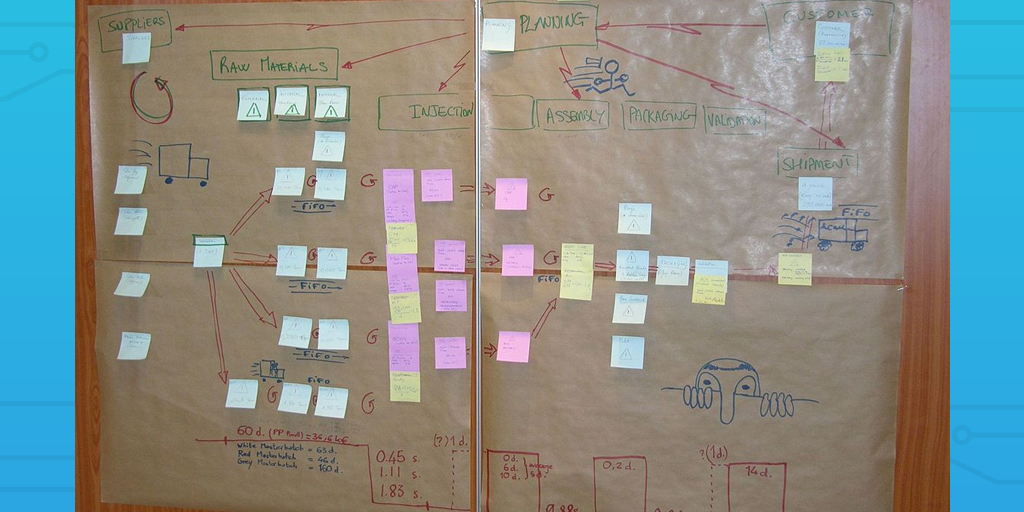
It doesn’t matter what you use so long as the theory and figures are accurate, whether that means formatting it up to look nice in a piece of dedicated software or drawing on a whiteboard in your office and taking a photo of it.
The key is to take your time and to truly get to grips with the current stats and flow of your business. Without that degree of brutal honesty about how things are currently being performed you can’t get an accurate idea of where you’re wasting the most resources.
Plus, if you’re already using some kind of business process management software (such as, say, Process Street) you can take the information logged in your regular process checklists to serve as the base for your value stream map.
So what are you waiting for? It’s time to get analyzing!
Do you have any value stream mapping tips to share? I’d love to hear them in the comments below!


Ben Mulholland
Ben Mulholland is an Editor at Process Street, and winds down with a casual article or two on Mulholland Writing. Find him on Twitter here.