
To excel at customer success, you need to understand your customer health score. According to a study by Gartner, 88% of Account Managers (CSMs) think they can grow by delivering a great service, which is reflected in your customer health score measures.
A customer health score is a metric used to determine whether customers are healthy or at-risk of dropping off. Customers with high health scores are high-value, repeat customers – this comes hand-in-hand with business growth.
In this Process Street article, we give you 7 vital indicators you need for determining customer health. We then explain how you can use these indicators to calculate customer health score values, before looking at examples of customer health scoring in practice.
Click on the relevant subheader to jump to your section of choice, alternatively scroll down to read all we have to say.
- Our secret source: 7 indicators for calculating customer success
- Calculating your customer health score
- Customer health scoring in practice
- Moving from a startup to big business and how this alters customer health score measures
Our secret sauce: 7 indicators for calculating customer success
A customer health score is a vital metric indicating what’s happening in your customer accounts early enough to act appropriately, reduce churn, and continue to grow. The measure determines an account’s wellbeing using qualitative measures.
Note: There are several terms used in the market describing the same metric, which include: account health score and customer success score. For the this article, we’ll be using the term customer health score.
As your team grows, you’ll need a structured, organized approach to customer success management, and for that, you need data and numbers.
Unfortunately, there’s no industry standard measure for calculating customer health scores which can cause confusion. That’s why I’ve put together this post for you. I’ve isolated 7 indicators that will help you build out the core to your customer health score measures. It’s important to avoid over-complicating calculations, especially at the beginning. With these 7 indicators, you can keep initial calculations simple-stupid while exposing the customer health information you need.
Your aim:
- To use your customer health score measures as a pulse for your accounts. Identify risky accounts from your healthy accounts.
- Assess the performance of your customer success teams. Who handles the healthy accounts? What are they doing right? Who handles the unhealthy accounts? Is there anything they can do to improve the health of these accounts?
- Use the account information to forecast renewals, spot opportunities for upselling, and know which customers will advocate the product.
Think of your customer health score as the eye for your customer success team.
Customer health score indicator #1: Net Promoter Score (NPS)
The Net Promoter Score is a customer satisfaction benchmark. It’s based on a single question sent to customers: “On a scale of 1-10, how likely are you to recommend our product to a friend or coworker?“
The responses to this question are typically placed into groups:
- 1-6: Detractors
- 7-8: Passives
- 9-10: Promoters
To calculate the Net Promoter Score, you’ll need to subtract the percentage of detractors from the percentage of promoters. Passives are ignored.
Net Promoter Score: promoters % – detractors % = Net Promoter Score (NPS) %
According to a Customer Think Net Promoter Score Benchmark Study, 46% of respondents had an NPS program. As a metric, NPS is easy to calculate, which explains its extensive use as a marketing metric.
What’s a good NPS value?
Each year NICE Sametrix, the co-developers of Net Promoter Score, benchmark leading brands according to their NPS. These benchmarks are used to compare a company’s NPS to the score of their competition.
As a general rule, companies with higher NPS scores grow faster and are more successful relative to competitors with lower NPS scores.
However, it’s important to note that NPS scores vary widely across industries. From an average NPS score of 58% for tablet computers to 47% for online entertainment, right down to -1% for internet service providers (as shown in the graph below).
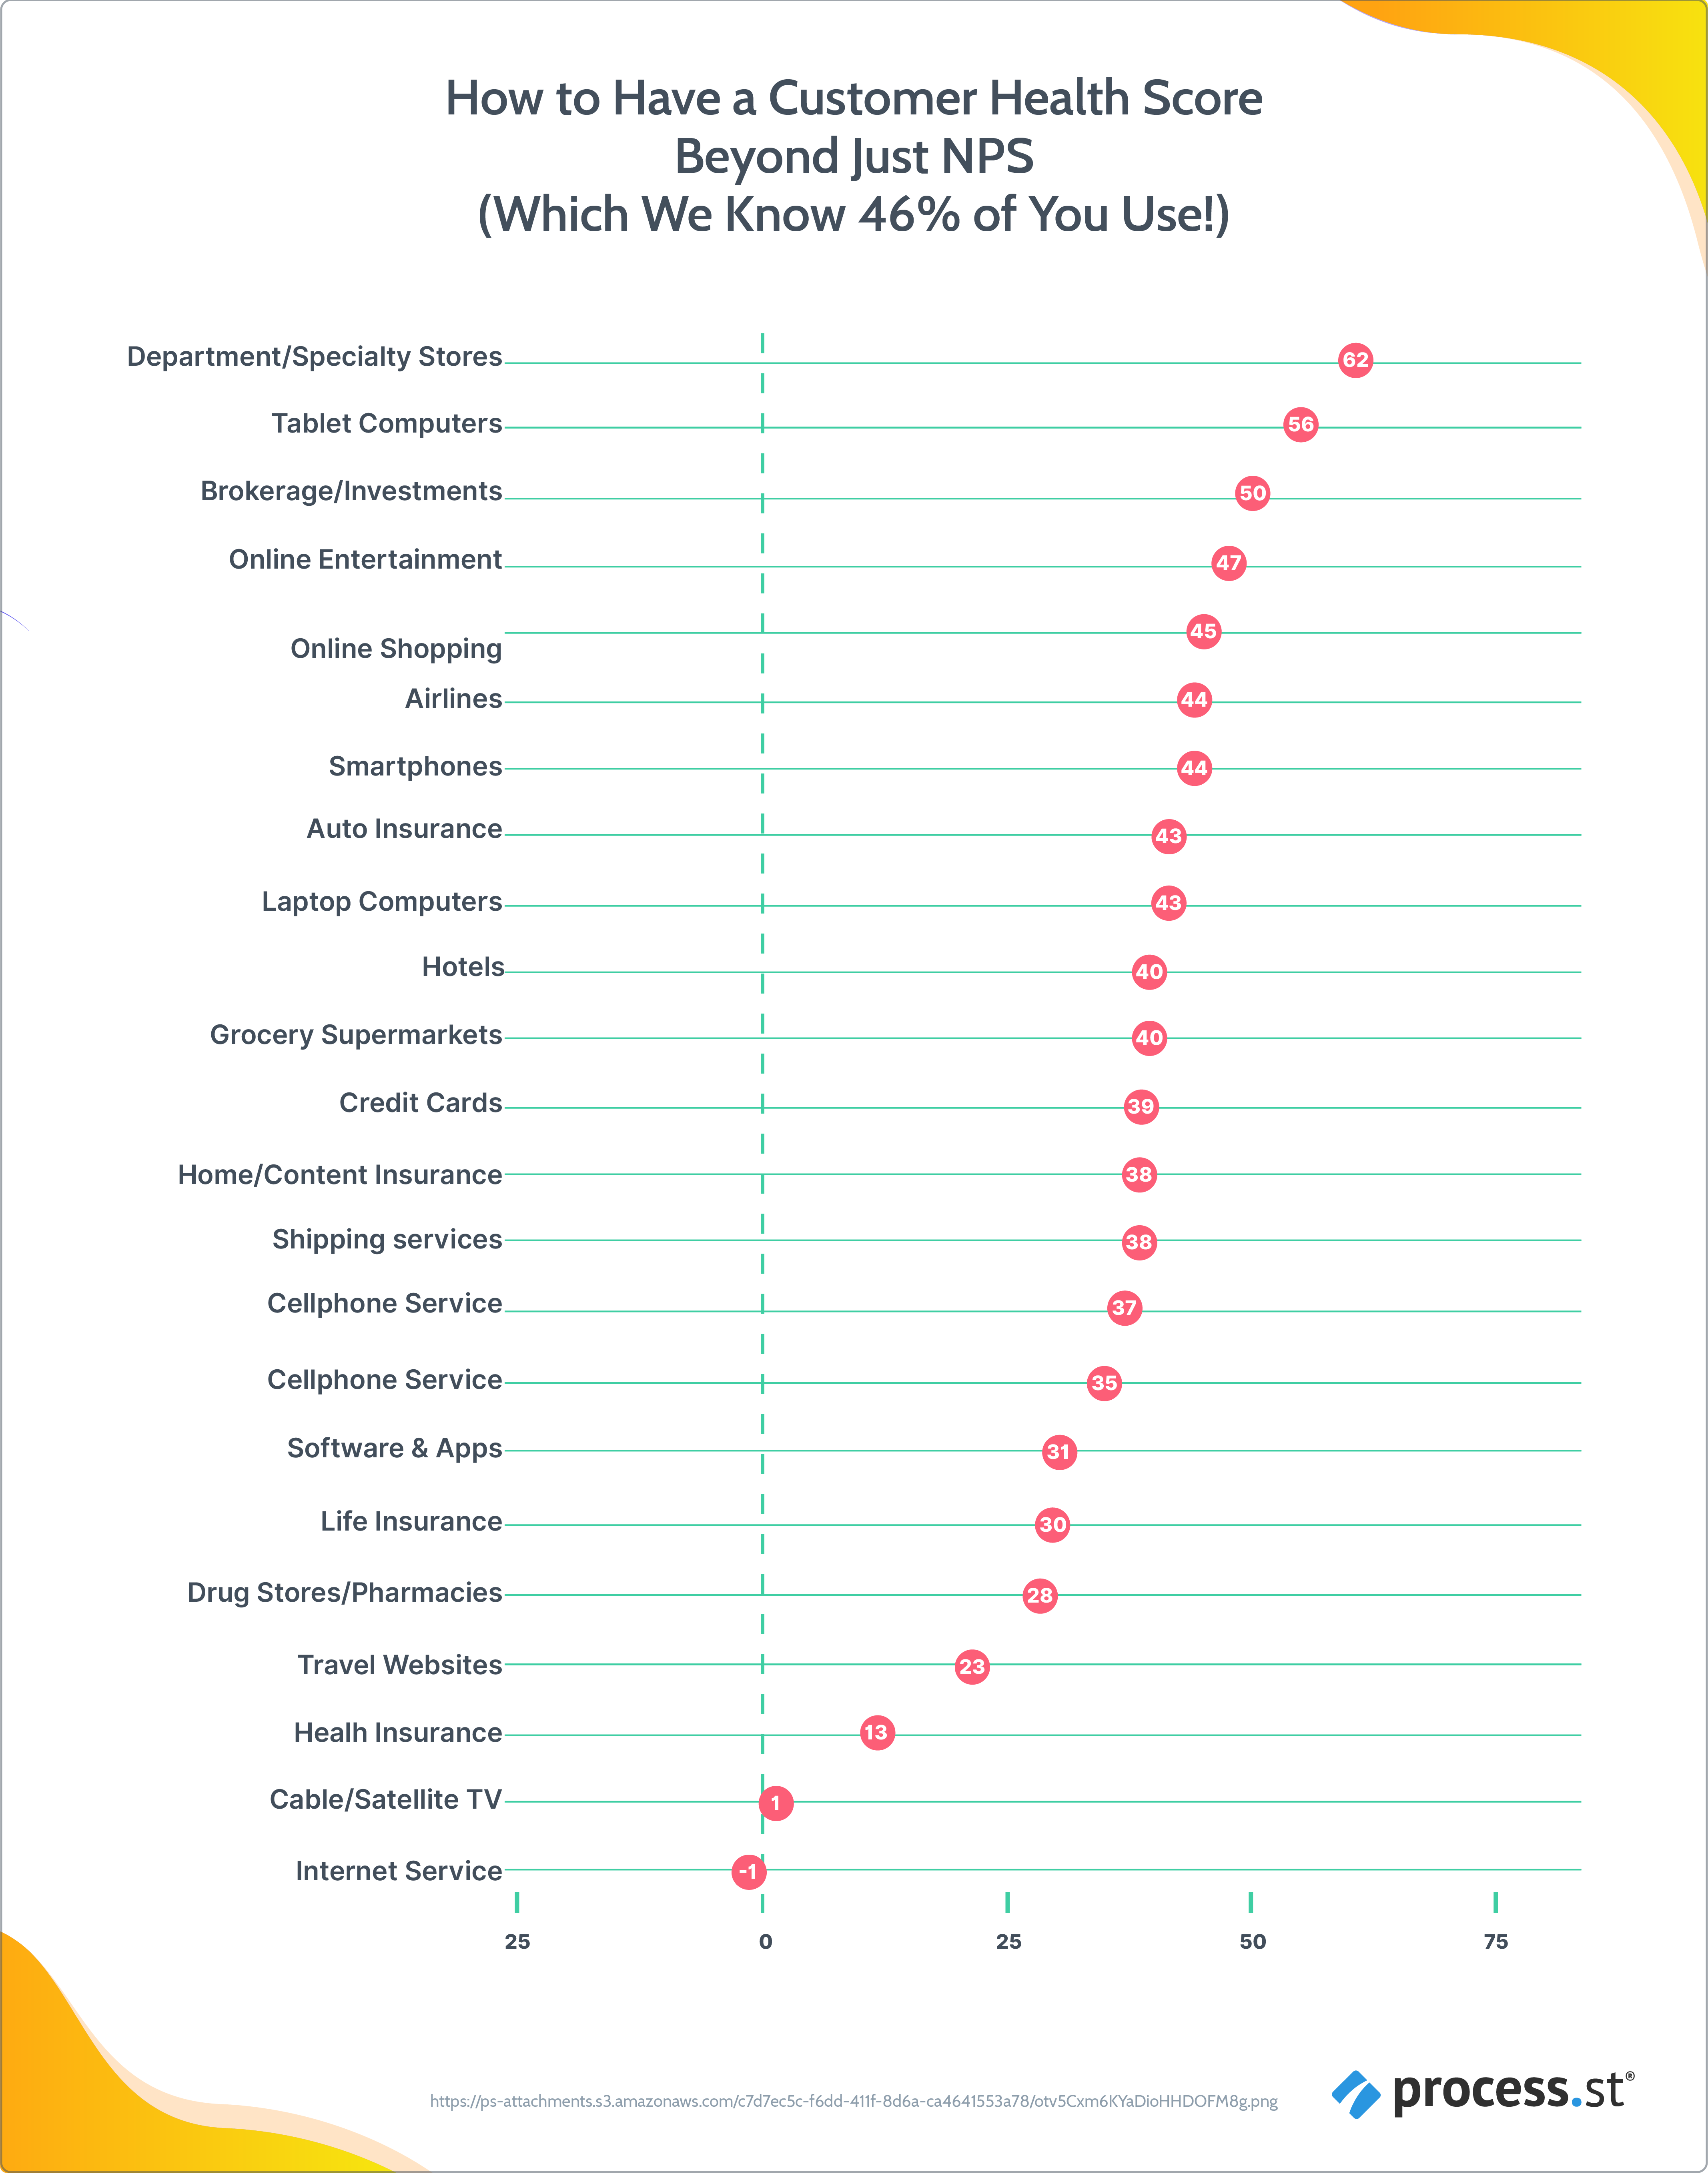
NPS leaders include Airbnb for travel websites (NPS = 43%), Apple for the smartphone industry (NPS = 68%), and TurboTax for the software and apps industry (53%).
NPS scoring is extremely attractive for a management team as a single, significant KPI measure. It’s often touted the single customer metric you need – but how true is this statement?
Research indicates the effectiveness of NPS scoring doesn’t hold up to claims. Once more, sole use of NPS as a customer health score measure does not give the necessary tool-kit for companies to strategize and influence the score – and if you can’t do that, what’s the use of asking the customer their opinion?
Calculating accurate and actionable customer health scores requires the use of NPS values and beyond. Use NPS measures along with the below-listed customer health indicators.
For more information about the Net Promoter Score and how to calculate it, read: How to Calculate NPS with the Perfect Customer Happiness Survey
Customer health score indicator #2: Product usage rate
The product usage rate measures how often users engage with your product in some meaningful way over a set period.
To calculate the product usage rate, consider the following:
- How much are your users engaging with your product/service and using it?
For instance, as a productivity application, if we at Process Street considered only users logging into the platform, and not users creating and completing checklist tasks regularly, then this wouldn’t be a reliable indicator of the product usage rate. - Normalize the usage rate for the population.
For instance, let’s say a small company with 10 employees signed up to Process Street. If they completed 10 tasks and checklists in a week, then this would be a good sign. However, if a company with 100 employees had only 10 completed tasks and checklists a week, then this would indicate a poor product usage rate.
Product usage rate: total number of users/signups ÷ number of active/engaged users
In summary, when considering the product usage rate, you need to account for the depth of product usage (% of product use) and the breadth of product usage (# of licenses).
Product usage rate indicates issues with your product/service offerings. Use this metric along with customer feedback/support ticket information to get to the root cause of where you’re going wrong.
Find out how to perform a root cause analysis, to get to the bottom of a poor-performing product/service offering by reading: How to Perform a Root Cause Analysis (Free Template)
Customer health score indicator #3: Customer Manager Pulse
The Customer Manager Pulse (CSM) is a subjective grade that Customer Success Managers give each account they manage. You can think of this measure as a gut check on the happiness of your customers.
This customer health score indicator is open to your interpretation on how you want to scale it.
Customer Success Managers (CSM) support your customers as they transition from sale prospects to active users of a product. CSMs are focused on knowing the customer, to build long-term client relationships.
The opinion of your CSM is, therefore, one you should consider with high regard.
“We trust CSM pulse/sentiment above all other indicators. Every operational metric can show green, but if the CSM has marked the pulse as red, it’s a red account. – Britt Hall, Gain, Grow, Retain: Customer Success Leadership Community
There will be risk factors to consider that aren’t covered by calculated metrics that greatly impact the health of an account/customer. The CSM pulse can override calculated scores, giving a qualitative measure of account health.
You will often find, however, that your CSM pulse will match your calculated score. Trust the system until it fails, then use your CSM pulse as a solid backup.
Use CSM advice to guide decisions to improve customer health score measures.
Customer health score indicator #4: Churn indicators
Churn measures how well or poorly your company keeps hold of the customers it acquires. We’re talking about how many stop paying vs. how many become long-term customers. It’s a metric expressed as an annual percentage figure, giving the number of customers who choose to stop paying for or stop using a service.
As a startup, you can use the relationship between customer churn measures and customer acquisition rate to understand how far you are from having long-term engaged users, from whom you make a profit.
For larger organizations, customer churn measures indicate the financial benefits you can bring by improving customer retention.
Customer churn rate: (number of customers at the period’s start – number of customers at period’s end) ÷ number of users at the beginning of the period
Churn rate is often calculated as a % monthly figure. Extrapolate an average monthly churn rate for the year, or use historical data to work out an annual average churn rate.
You can also calculate churn as a probability measure (i.e. what is the probability of your customer churning each day?).
To do this, you’ll need the same inputs as previously used, but this time, you need to calculate the number of days customers collectively spent active (remaining a paying customer).
For more information, read: What is Churn Rate? How to Calculate Customer Churn (Definition + Meaning)
The above article gives actionable tips on how to reduce customer churn, and hence improve your customer health scores. More information on each tip is given in the article presented, but I’ve summarized our 3 top tips below, as quoted by Adam Henshall.
- Document standard operating procedures for analytics to be incorporated and used across teams. If you build analytics into your processes then provided those are followed you will be mandating an appreciation of analytics across your organization.
- Have a team that creates and improves analytical approaches for other teams across the organization to employ. This allows other teams to focus on their tasks and on generating value for the business.
- Utilize teams with an array of skill-sets to increase knowledge spillover within the organization. This should allow teams to be more agile and reduce bottlenecks caused by information being transferred from department to department.
– Adam Henshall, What is Churn Rate? How to Calculate Customer Churn (Definition + Meaning)
As your ultimate business process management solution, Process Street has been working hard to give you access to the workflows you need. I recommend you hop in and browse our template library, which is packed with free pre-made templates.
In this library, you’ll find templates dedicated to reduce and prevent churn. For your convenience, I’ve embedded these workflows below:
Reduce Churn Checklist
Run our Reduce Churn workflow to track and reduce churn by bolstering your customer support and marketing processes. This template should be started and completed at the end of every month.
Click here to access our Reduce Churn workflow!
Key checklist feature: Our Stop Tasks feature makes sure vital tasks are completed before the user can progress in the workflow. Stop Tasks also ensure task order. For instance, it’s impossible to know how to reduce your churn rate going forward until you’ve separated what you’re doing right (successes), from what you’re doing wrong.
Churn Prevention Checklist
Run our Churn Prevention Checklist when a high-value customer expresses a desire to cancel their subscription.
Click here to access our Churn Prevention Checklist!
Key checklist feature: Our Conditional Logic feature adapts the churn prevention checklist to suit your specific needs. For instance, as you run through an active workflow you’ll be asked questions such as are you able and willing to extend a special offer to the customer? What tasks come next in the workflow is dependent on the response you give.
Customer health score indicator #5: Number of support tickets and customer feedback
A customer support ticket describes customer support interactions between you and your customers. Information such as date, time, the issue itself, and contact information is stored. All this information is dynamic and can be changed or adjusted once such a need arises.
Your customers expect you to have full knowledge and visibility of their previous interactions and purchases. For instance, a Microsoft survey found >75% of consumers expect this, with less than half suggesting agents rarely or only occasionally have the context to effectively and efficiently solve their issues. Customer support tickets grant access to the information needed for a seamless service experience, and a consequentially improved customer health score. I.e. there’s no need to ask your customers the same questions again, and again, and again – it’s all in the ticket.
Once more, you can view your customer support tickets and the feedback given to determine where you can improve your business/service offering. Think: What issues keep arising?
Once more, online ticketing systems typically come with built-in reporting possibilities, meaning a variety of customer service metrics/KPIs can be tracked. This includes metrics such as channel usage, ticket volume, and ticket resolution time. These metrics form the foundation for measuring your overall customer service performance and efficiency, giving valuable insight on where you need to optimize your service operations.
Customer health score indicator #6: Customer Satisfaction Score (CSAT)
The Customer Satisfaction Score (CSAT) is a customer loyalty metric used by companies to gauge how satisfied a customer is with a particular interaction or overall experience.
CSAT is one of the three most popular loyalty metrics, often used alongside the Net Promoter Score (NPS).
Customer satisfaction can be assessed by asking customers: “How would you rate your overall satisfaction with [brand]“?
At Process Street, we recommend you ask respondents to leave a comment to explain his/her ratings. More context is always best.
Ask your customers to respond on a 5-point scale, the options being:
- Very unsatisfied
- Unsatisfied
- Neutral
- Satisfied
- Very satisfied
Once you’ve collected feedback via your customer satisfaction survey, there are two ways you can calculate your CSAT score:
- You can calculate a scoring average.
- You can calculate the percentage of customers who are satisfied (the 4-5 scores).
Customer Satisfaction Score: (Number of 4-5 responses ÷ total response volume) x 100
To give your CSAT score context, compare your score to industry peers and competitors. To do this, look at the American Customer Satisfaction Index (ACSI). The ACSI is a national economic indicator measuring customer satisfaction across the U.S. economy.
According to ACSI, the average CSAT score for U.S. businesses in 2020 was 74.4% (with industry variation). E.g. Airlines CSAT score = 75%, computer software CAST score = 76%, and the Internet Social Media CSAT score = 70%.
Customer satisfaction goes hand in hand with a great customer experience and healthy accounts. Research by McKinsey & Company shows that maximizing satisfaction across the customer journey has the potential to increase customer satisfaction by 20% and boost revenue by up to 15%. Satisfied customers more likely to upgrade and add services, and less likely to cancel. Hence, good CSAT = health customer accounts.
It’s easy to want to use the CSAT score everywhere, but you should fight this temptation. Take a step back to determine where and how CSAT measures can benefit your company. Outline your CSAT goals, which could include measuring purchasing experiences, support calls satisfaction, survey response rate, or periodic satisfaction check-ins.
Listen to the feedback given, especially from added context requested, and implement the changes as required. Audit internal and external factors to scout for pain points. That is, what internal and operational factors could be leading your customers down the path of dissatisfaction? What external factors are impacting your CSAT scores (e.g. brand quality, and omnichannel experiences)?
Customer health score indicator #7: Industry analysis
Industry analysis is a marketing assessment tool used by businesses and analysts to understand the competitive dynamics of an industry.
Conducting an industry analysis will give you a sense of what’s happening in the industry, e.g. demand-supply statistics, the degree of competition, the state of competition, and other emerging industries and future industry prospects.
Industry analysis helps you identify account threats, and is key to surviving in an ever-changing business landscape. For instance, what are your healthy customer accounts today, and how will this alter in the future according to external forces?
There are two commonly used methodologies for performing industry analysis, which include:
- Competitive Forces Model (Porter’s 5 forces): Porter’s Five Forces gives an accurate impression of the industry. This method identifies potential entrants, the bargaining power of buyers, the bargaining power of suppliers, the threat of substitute goods/services, and the power of complementary good/service providers. These are forces that dictate the intensity of industry rivalry.
- SWOT Analysis: SWOT stands for Strengths, Weaknesses, Opportunities, and Threats. It’s a means of summarizing the various industry forces to determine their implications for the business in question.
To help you conduct a SWOT analysis, check out Process Street’s premade SWOT Analysis Template, which you can access for free using your Process Street account.
SWOT Analysis Template
Run our SWOT Analysis Template to perform a SWOT industry analysis.
Click here to access our SWOT Analysis Template!
Key checklist feature: Our Approvals feature allows the user to give the go-ahead or rejection after a SWOT Analysis review. This ensures accuracy of the industry analysis undertaken.
You can document any workflow as a template. I recommended you document Porter’s 5 Forces industry analysis process as a Process Street workflow – as we’ve done for the SWOT Analysis. For more information on how you can document workflows using Process Street, watch the below video.
Calculating your customer health score
The above customer health score indicators are your data inputs. Use this data for customer health scoring by following the 5 simple steps below.
Step 1: Select your outcome
A customer health score is based on the likelihood of a particular outcome. You’ll want to be able to look at an account’s health and immediately recognize whether the customer is liable to churn or recognize an upsell opportunity.
The outcome you want to select is dependent on your unique circumstance. If you’re having trouble keeping your customers onboard, then you may to heavily utilize churn rate measures.
Alternatively, you may have fantastic retention rates, and you’d like to drive some additional revenue via your existing customer base. In this instance, you’ll want to focus on your product usage rate to broaden and upsell product/service features adopted.
Note: You won’t have one outcome. It’s likely that you start with one outcome and then move onto another later in the process.
Step 2: Nail down your predictive signals
On determining the outcome to base your customer health score on, you need a way to predicting the likelihood of that outcome. A predictive signal is a behavior related to the outcome you selected.
For instance, let’s say you wanted to reduce churn in your organization. You need to ask yourself, what behaviors may indicate that the customer is liable to churn?
Behaviors could be a lack of product usage and narrow product scope – behaviors that will be captured from calculating the product usage rate.
The closer the correlations between your health score signals and your outcome, the more accurate your health scoring will be.
Note: Selecting predictive signals requires you to make some assumptions. For instance, you may assume a positive correlation between product usage rate and a reduced likelihood of customer churn. Make sure you’re challenging, adapting, and adjusting your assumptions as you go.
Step 3: Assign weights to your signals
Something that may not be immediately obvious when selecting your predictive signals is the fact that one signal will not be equally indicative of the outcome your tracking relative to an alternative signal.
For instance, product usage rate will give you a sort of indication of churn likelihood, but calculating your churn rate will give a more accurate, quantitative assessment.
If you treat your predictive signals with equal importance, then your customer health score won’t be accurate. You need to assign different weights to each signal for your health score to be meaningful.
How do you do that?
I recommend talking to your customer success representatives. These are people who regularly interact with your customers, and will have a strong sense of which signals are more or less important. For instance, there may be accounts that have low product usage rates but rave about your product and aren’t liable to churn (this will be reflected in your CSAT score). In this instance, your CSAT score needs to be assigned a stronger weight when determining customer health.
Let’s consider a hypothetical scenario to exemplify this weighting in action. Say you noticed 85% of your churned customers had a product usage rate less than 5. That’s a strong correlation between churn rate and product usage. Meanwhile, let’s say 40% of your churned customers have a low CSAT score – that’s a weaker correlation. In this instance, product usage rate needs a higher weight than the CSAT score. We weigh customer health indicators (taking in into account other predictive signals of churn).
- Product usage rate: 40%
- NPS score: 20%
- CSAT score: 20%
- CSM pulse: 20%
Note: All weights need to add up to 100.
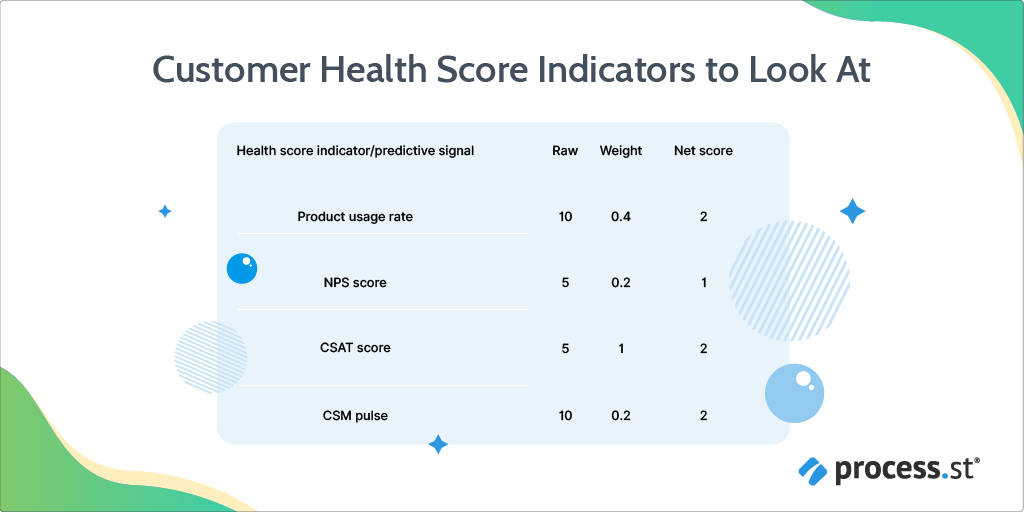
Without a strong weight for the product usage rate, you would have an inaccurate reflection of an account’s health.
Totaling the Net Score gives the overall customer health score. In this case, the customer health score is equal to 7 (70%).
If we weighted the above customer health indicators equally (0.25 each), our overall customer health score would be 7.5, making the account appear healthier than it is.
Step 4: Develop a health score scale
At this point, you’ve determined the outcome you’re going to predict, how your going to predict this outcome, and you’ve weighed the predictive signals according to their importance. Now, you’re technically ready to assign health scores to your customers.
To benchmark your customer health score, develop a health score scale. I recommend using 0-100 as your scale. With a scale, you can distinguish buckets of customers based on where they sit on this scoring system. For example, anyone sitting within the bucket score of 0-39 are deemed unhealthy. You can visualize this bucket scoring system in the table below:
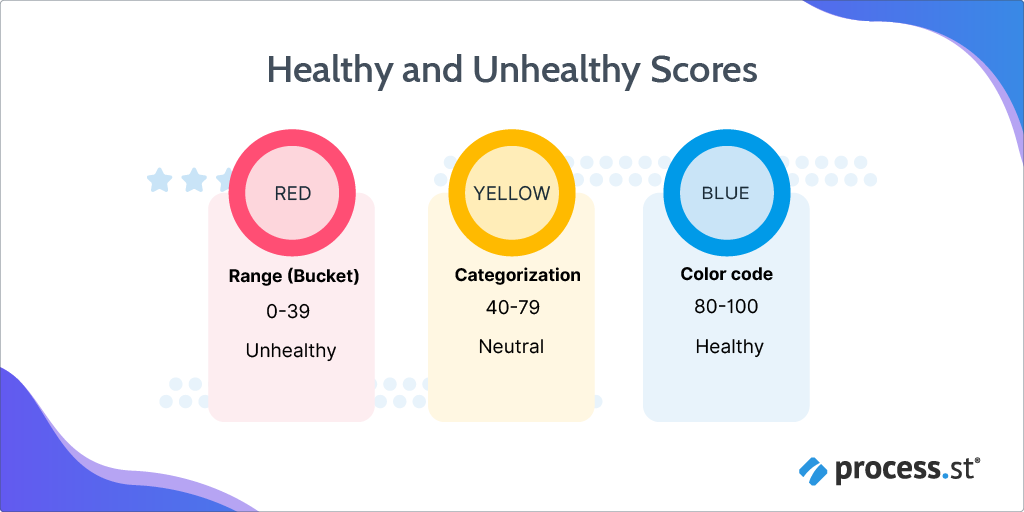
Each customer health score signifies a meaningful message about the relationship your customers have with your company.
Note: More segmentation leads to better results and the development of more pointed strategies.
Step 5: Strategize
The whole point of customer health scoring is to improve customer relationships in a logical, mutually beneficial way.
Think about how you’re going to respond once the customer has been scored, to implement the data you’ve worked hard to obtain.
Note: Refresh your system regularly, with each iteration you can revise your assumptions and make adjustments as appropriate. The success of your system will depend on your willingness to adapt. I recommend conducting annual updates.
Customer health scoring in practice
Let’s take a look at health scoring in action used by organizations across the globe.
Assignar: CSM Rachel Jennings explains the importance of categorizing

Rachel Jennings, CSM at Assignar, defines clear sub-categories indicating an account is at risk of churning.
Jenning’s uses the following categories:
- Reduction
- No/small usage of key features
- Too many or no support conversations
- Low survey scores
- Sudden stop in references/speaking engagement
- Overdue invoices
- A combination of the above
Based on these categories, Jennings defines specific actions to measure, for instance, the number of logins and customer interactions. These actions are then placed into two main categories, labeled product or relationship. The product category is weighted 60% of the customer health score, and the relationship category is weighted 40% of the customer health score.
Each sub-category is scored out of 5, 1 being the danger zone, and 5 being the healthy zone.
Talix: David Lahey explains the importance of creating a customer journey map
David Lahey, a Strategic Leader specializing in Customer Success at Talix, gives the importance of mapping the customer journey steps. This means mapping the first interactions your customer has with your brand, e.g. opening emails. To the last steps, where you can determine the ROI for your customers.
Work your way down the customer path, and decipher the master records a customer needs to create to gain value, e.g. this could be the number of inventory items. The customer health score of higher value customers needs to be considered with higher regard.
User IQ: Emphasizes the importance of using a range of customer health score indicators
User IQ monitors 5 key churn variables to calculate the customer health score. These variables (customer health score indicators/predictive signals) include:
- Login activity: Based on the frequency of monitor logins into the User IQ platform.
- Feature adoption: Based on the number of unique features that each account is using within the product.
- Sentiment: Tracked through the Net Promoter Score (NPS) surveys.
- Technical support: Calculated based on the number of support tickets that are fulfilled and closed by an account of the customer.
- Financial support: Measured by a customer’s monthly rate, whether payments are made on time or delayed, and the validity of the account’s credit card.
Moving from a startup to big business and how this alters customer health score measures
Calculating accurate customer health score measures can be time-consuming, especially as an organization grows. With new customers come new pain points, and a greater range of customer needs.
Smaller, startup organizations need to be flexible and adaptive in their approach to calculating customer health scores.
This is what we initially did at Process Street. I spoke to Blake Bailey, Customer Success Team leader, who pointed out that, due to the smaller size and limited resources, startups have to be creative in how they calculate customer health scores.
“[Larger organizations have the resources to use] Gainsight and tools like it, which are expensive – like 40K a year expensive. This expense mounts up meaning smaller companies don’t have access to these tools.” – Blake Baily, Customer Success Team Leader at Process Street
Larger organizations will use tools such as Gainsight to calculate customer health scores and do the heavy work for them.
Blake explains how we measure customer health at Process Street:
“There are basic metrics we look at – namely checklist runs and web sessions per person – as indicators of activity. During onboarding, we also look at template edits and views, as an indicator of the user getting set up. We then eventually, transition into the standard checklist metrics. We pull our data every quarter or so and I run an analysis based on specific activities that we are targeting.
For example, last quarter we were promoting BI Integrations, so I created health scores around checklist exports and checklist dashboard views. Then, I mixed those with our general activity scores to determine who was most likely to want the BI Integrations upgrade.” – Blake Bailey, Director of Customer Success at Process Street
Blake hits on an important point that I want to raise before wrapping up this article:
Your customer health scores are only a small part of the story.
The real insight is in the trend of customer health score measures over time. For instance, an account may have a customer health score of say 80% today, but if it was 90% the previous month, there’s cause for concern.
As we do at Process Street (every quarter), you need regular customer scoring iterations.
Optimize your service/product delivery using customer health score measures
Start small.
Use the 7 customer health score indicators given in this article to build a solid foundation forming the base your customer health score measure on. Then, following the 5 simple steps, calculate the customer health scores for your accounts, identify at risk accounts, and strategize accordingly.
You can think of customer health scores as the eye for your customer success team, for them to understand what your brand is doing right regarding customer relationships, and where improvements are needed. Without customer health scoring, your customer success team is running blind.
How do you calculate customer health scores for your organization? What customer health score indicators do you use? What tools do you use? We’d love to hear from you, please comment below.