






Customer experience measurement is the practice of combining direct customer feedback, journey context, operational performance, and business outcomes to understand what customers experience and decide what to improve next.
This is a guest post by Alyse Falk. Follow Alyse on X. Alyse is a freelance writer covering technology, data analytics, cloud computing, cybersecurity, machine learning, and IoT.
Customer feedback stops you from guessing about what customers do and do not value. Measurement turns that feedback into a repeatable system: collect evidence, connect it to a touchpoint, compare it with behavior and outcomes, assign an owner, and check whether the change worked.
Customer feedback is integral to understanding how to deliver a consistently good customer experience. By gathering feedback, you stop guessing about what customers do and do not like and gain direct action items for how to improve customer experience in the future. Better service quality can lead to greater customer satisfaction, loyalty, and advocacy, but the team still needs a disciplined way to connect each signal to the work that produced it.
In this guide, I will explain how to measure customer experience, how to choose the right customer experience metrics, and how to build a scorecard that helps your team reach the real aha moment: not simply seeing that a score moved, but understanding why it moved and what action to take.
- What is customer experience measurement, and why measure CX?
- What to do before measuring customer experience
- The key customer experience metrics
- Building a CX measurement scorecard
- How Process Street supports customer experience measurement
If you want to start collecting structured feedback, use the Customer Feedback Checklist Template from Process Street.
Customer Feedback Checklist Template
Use the Customer Feedback Checklist Template
What is customer experience measurement (and why measure CX)?
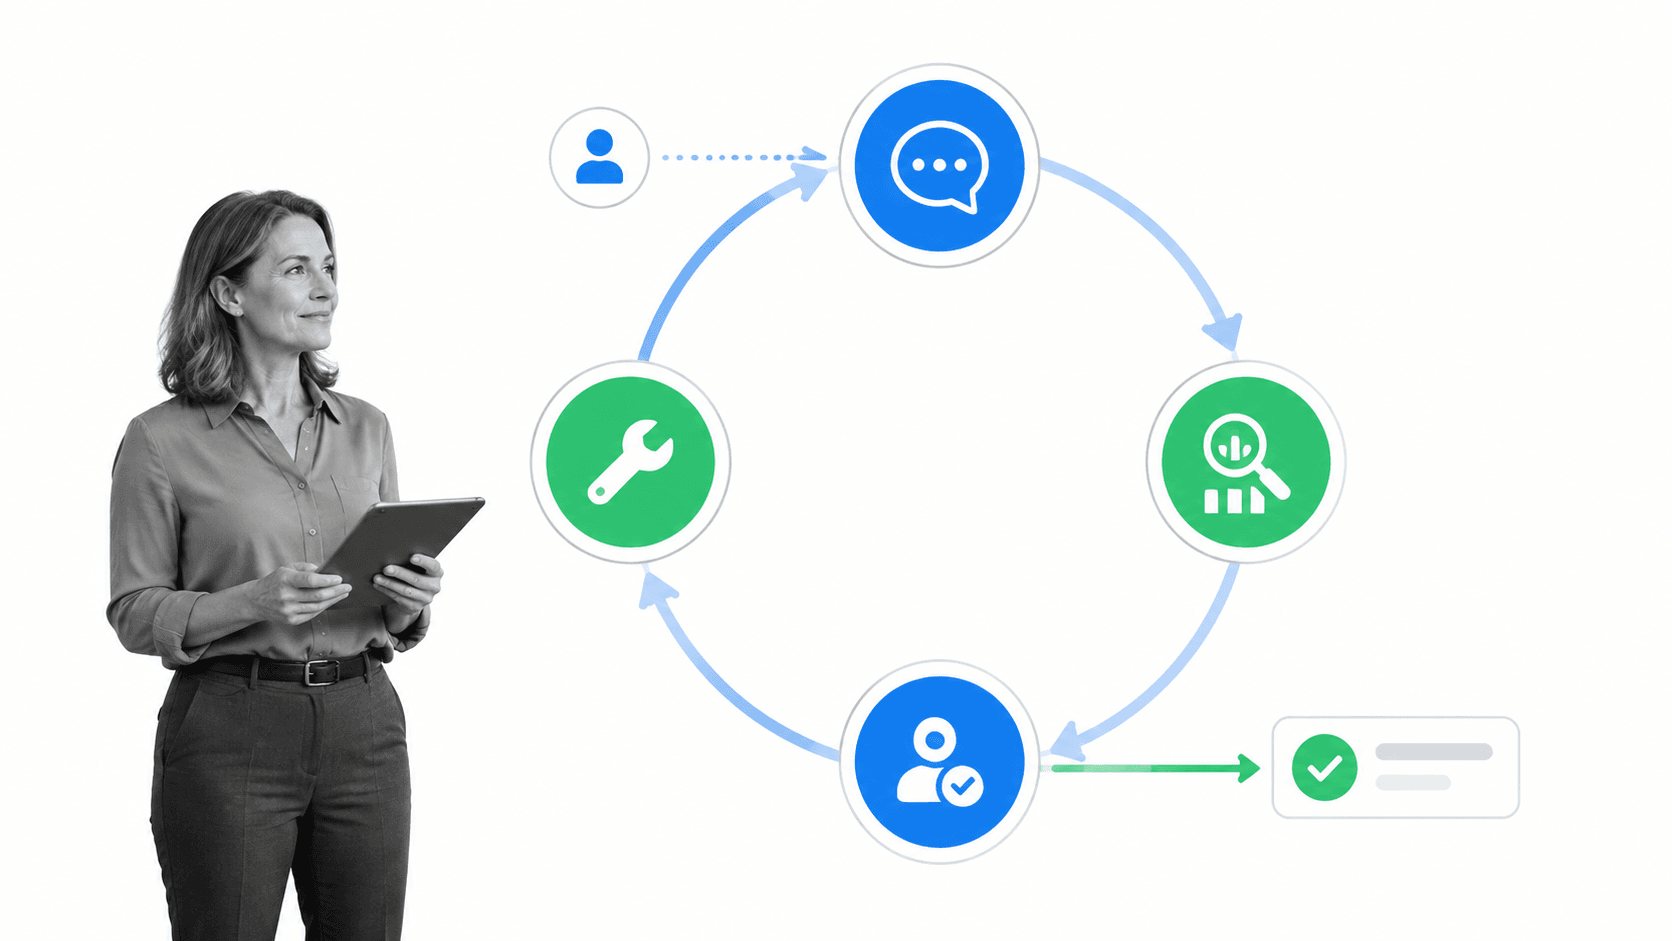
Customer experience measurement tracks how customers perceive and navigate their relationship with a company across the full journey. It brings together what customers say, what they do, how effectively the company serves them, and whether those experiences lead to outcomes such as adoption, retention, or advocacy.
Survey metrics such as customer satisfaction score (CSAT), net promoter score (NPS), and customer effort score (CES) are useful, but none is a complete customer experience measurement framework on its own. A strong program also studies journey touchpoints, support performance, qualitative feedback, and business outcomes. Current CX measurement guidance likewise treats experience as a system of complementary signals.
Measuring CX helps your team:
- test assumptions about customer needs, satisfaction, and product-market fit
- identify the journey stages and touchpoints creating friction
- compare experience across segments, channels, products, and lifecycle stages
- connect customer perception with operational measures such as response and resolution time
- set goals, assign owners, and verify whether an improvement changed the outcome
- find the reasons behind a metric change through interviews, comments, and support conversations
The purpose is not to produce more dashboards. It is to create a voice-of-customer feedback loop in which evidence leads to an owned decision, a change in the operating process, and a later review of the result.
That loop also protects against a common measurement mistake: treating the average as the customer. A stable overall score can hide a poor experience for a new segment, a specific channel, or one important journey stage. Review distributions, comments, and segment differences before concluding that the experience is improving.
Customer experience measurement gives you a better perspective on product-market fit, customer satisfaction, and expectations. It helps improve service quality, validate assumptions, assess the effectiveness of the CX strategy, improve customer engagement, and set goals for future improvements. The useful question is which evidence can guide a decision your team is prepared to make.
What to do before measuring customer experience

Before selecting metrics, learn more about your target audience, map the customer journey, and assess the problem areas you need to understand. This preparation ensures the numbers have a clear context and a practical use.
Get to know your target audience
You must know your customers before conducting customer experience measurement. Define the segments that matter to the decision: new and established customers, different roles, product plans, regions, use cases, or support histories. The same score can mean different things for customers with different expectations.
Use interviews, support conversations, product behavior, sales notes, and surveys to understand what customers are trying to achieve. Record their needs and expectations at each touchpoint. Avoid averaging unlike experiences into a single score when segmentation would reveal the real pattern.
Understanding your target audience gives you a practical advantage because it makes customer communication and service more relevant. To measure customer experience, understand customer expectations and needs in terms of what makes them satisfied with your products or services. Create a timeline of the customer journey and point out their needs and expectations at each touchpoint along that journey.
Map the customer journey and identify the touchpoints
Map the journey from the customer perspective. Identify the moments when customers form an opinion, such as evaluation, purchase, onboarding, first value, support, renewal, or cancellation. Each touchpoint needs a clear customer goal, an owner, and evidence that shows whether the experience worked.
Identify the key points when customers interact with your brand and form their opinions. Think of each touchpoint as an opportunity to improve customer experience. The map should show the customer goal, channel, emotional or effort signal, operational handoff, and evidence available at that moment, not only a sequence of internal departments.
Improving customer journeys can produce lower cost to serve and stronger revenue outcomes, but a journey map is only the starting point. The value comes from improving the work behind those moments and measuring the result. McKinsey describes this relationship in its research on customer journeys, revenue, and service costs.
Customer Journey Map Template
Use the Customer Journey Map Template
Assess your problem areas and work on them systematically
Once you understand the audience and journey, name the decisions the measurement system must support. You might need to diagnose onboarding delays, reduce repeat support contacts, understand why a segment is churning, or verify whether a new policy improves resolution quality.
Evaluate your current CX strategy by identifying the key problem areas, assessing each problem, and working on them systematically. Rank the issues by customer impact, frequency, risk, and the team’s ability to change the underlying process. Measurement should make the next improvement clearer, not create an inventory of problems with no owner.
Write a short measurement question for each problem. Then identify the customer signal, operational measure, business outcome, data source, owner, and review cadence needed to answer it. This prevents teams from collecting feedback they cannot use.
Document the baseline before changing the process. Record the current measure, time period, segment, sample size, exclusions, and known data limitations. Without a baseline, the team may celebrate normal variation or compare two groups that were never equivalent.
The key customer experience metrics (and which ones to choose)

There is no universal metric that works for every business. Choose a balanced set that reflects the customer relationship, individual interactions, operational delivery, and business outcomes. One score can be a signal, but it cannot represent the whole experience.
Make sure you measure things that are relevant to your business and make sense for customers. Decide how the feedback will be used before surveying anyone. Do not overload customers with unnecessary questions. Every question should be clear, serve a particular purpose, and connect to an action or learning goal.
- Start with the customer or business decision you need to make.
- Choose a perception metric for what the customer felt or believed.
- Pair it with an operational measure showing what happened.
- Add a business outcome when the relationship is plausible and useful.
- Collect qualitative comments or interviews to explain why the numbers moved.
- Define the segment, touchpoint, sample, cadence, owner, threshold, and action before collecting data.
For example, a support team might pair CES with first response time, resolution time, repeat-contact rate, and the customer’s written explanation. A customer-success team might pair relationship NPS with adoption, time to value, renewal risk, and interview themes.
Sampling matters as much as the formula. Ask for feedback close enough to the interaction that the customer remembers it, but avoid sending a survey after every minor event. Monitor response rate and nonresponse bias. Customers who answer may have unusually strong positive or negative views, so survey results should be interpreted alongside behavioral and operational evidence.
Customer Feedback Survey Process
Use the Customer Feedback Survey Process
Customer satisfaction score (CSAT)
Customer satisfaction score measures satisfaction with a specific product, service, or interaction. It is most useful when the question is close to the experience being evaluated. A common question is: “How satisfied were you with this experience?” on a five-point scale from very dissatisfied to very satisfied.
CSAT is one of the easiest customer experience metrics to track because the question is direct and the result can be tied to a specific moment. It can help identify which products, support interactions, or journey stages resonate with the audience, especially when the response is segmented and reviewed with open-text feedback.
Define positive responses before reporting the score. On a five-point scale, teams often treat ratings of four and five as positive.
CSAT = positive responses ÷ total valid responses × 100
Use the same scale, timing, audience, and positive-response definition when comparing results. SurveyMonkey provides a useful explanation of CSAT and NPS.
Net promoter score
Net promoter score measures willingness to recommend a product or business. The standard question uses a zero-to-ten scale. Respondents scoring nine or ten are promoters, seven or eight are passives, and zero through six are detractors.
NPS is commonly used as a relationship or loyalty signal. The quality of customer experience can influence willingness to recommend, but the score does not explain the reason by itself. Ask a short follow-up question and compare themes across promoters, passives, and detractors before deciding what the number means.
NPS = percentage of promoters − percentage of detractors
Passives contribute zero to the subtraction, but they remain part of the total response denominator. NPS ranges from −100 to 100. Bain’s Net Promoter methodology explains the calculation and categories.
Customer effort score (CES)
Customer effort score measures how easy or difficult it was to complete a task, resolve an issue, or get help. A common statement is: “The company made it easy for me to handle my issue,” followed by a five-point or seven-point agreement scale.
Many companies aim to make customer interactions as easy and effortless as possible. CES is useful for measuring the effort customers put into accomplishing a particular task, such as finding a product, completing onboarding, or resolving a support request. Measure it close to the interaction and keep the scale direction obvious.
Choose one scale direction and keep it consistent. Report CES as the average rating or as the percentage of favorable responses. Do not subtract strong disagreement from strong agreement unless you have deliberately defined and documented that custom method.
First response time and average handling time
First response time (FRT) measures how long customers wait for the first meaningful response. Average handling time (AHT) measures the average time spent handling a contact, commonly including talk or interaction time, hold time, and after-contact work.
Average FRT = total time to first response ÷ number of first responses
AHT = total talk, hold, and after-contact work time ÷ number of handled contacts
Faster is not automatically better. Pair speed with resolution quality, repeat-contact rate, customer effort, and satisfaction so the team does not optimize for quick but incomplete answers.
Customer lifetime value (CLV)
Customer lifetime value estimates the economic value of a customer relationship. A simple revenue-based model multiplies average purchase value, purchase frequency, and average customer lifespan. A margin-adjusted model applies gross margin to the result.
CLV = average purchase value × purchase frequency × average customer lifespan
Use cohorts when customer behavior differs significantly by segment. HubSpot provides a current overview of customer lifetime value calculations.
Churn rate
Customer churn rate is the percentage of customers who leave during a defined period. For standard logo churn, use customers lost during the period divided by customers at the start of the period. Define cancellation, inactivity, and reactivation consistently. Read more in Process Street’s guide to churn rate.
Customer churn rate = customers lost during the period ÷ customers at the start of the period × 100
Churn Prevention Checklist
Use the Churn Prevention Checklist
Customer retention rate
Customer retention rate is the percentage of starting customers still present at the end of a defined period after removing customers acquired during that period from the ending count.
Customer retention rate = (customers at period end − new customers acquired) ÷ customers at period start × 100
Churn and retention describe outcomes, not causes. Segment them and connect them to onboarding, adoption, support, feedback, and journey evidence before deciding what to change.
Building a CX measurement scorecard

A customer experience measurement scorecard links the metrics you chose into one decision system across the customer journey. It should make the objective, measure, segment, target, current result, trend, owner, review cadence, and next action visible.
Build the scorecard in seven steps:
- Name the journey stage or touchpoint and the customer outcome you want.
- Choose one or two customer-perception measures, such as CSAT, NPS, or CES.
- Add operational measures that can explain delivery, such as response, resolution, error, or completion time.
- Add a business outcome when it is useful, such as activation, retention, churn, or expansion.
- Define the segment, sample, source, frequency, target, warning threshold, and accountable owner.
- Add qualitative evidence from interviews, comments, support conversations, or journey observations.
- Record the action, due date, evidence required, and date when the result will be reviewed.
Use both leading and lagging indicators. A leading indicator might show that onboarding completion or time to value is deteriorating. A lagging indicator might show renewal risk or churn later. The relationship is a hypothesis to test, not proof of causation.
Set a review cadence that matches the decision. Operational measures may need daily or weekly attention. Relationship surveys may be monthly, quarterly, or tied to lifecycle events. Avoid surveying the same customers so often that the measurement process damages the experience.
When a threshold is crossed, the scorecard should say what happens next. A warning might trigger an investigation, a customer follow-up, a journey review, or a process-change proposal. Define who can approve the response and what evidence is required to close it. A red cell without an action path is decoration, not management.
Keep a short decision log beside the scorecard. Record what changed, the evidence behind the decision, the expected result, and the date for review. This makes it possible to separate real learning from repeated guesses and helps new owners understand why a workflow or policy exists.
AI can help summarize open-text feedback, group themes, retrieve related customer evidence, and flag unusual changes. A person should still validate the interpretation, protect privacy, review segment bias, and decide what action is justified. The scorecard is valuable because it connects that analysis to accountable work.
The aha moment arrives when a metric and the qualitative evidence explain each other. A falling CES score might point to a difficult support path, while comments and repeat contacts identify the exact handoff causing the effort. That is enough context to change the process and measure again.
Voice of the Customer Six Sigma Template
Use the Voice of the Customer Template
Use Process Street to help with radically improving customer experience!
Process Street is a Compliance Operations Platform. It is one product with Docs and Ops capability areas plus built-in AI.
Teams use Docs to create and govern customer-experience policies, measurement definitions, survey standards, service procedures, and scorecard rules. Version history and approvals help everyone work from the same current guidance.
Teams use Ops to run repeatable feedback, journey review, support, onboarding, churn-prevention, and improvement workflows. Each run can assign owners, collect evidence, apply conditional logic, route approvals, track due dates, and preserve an audit trail.
Built-in AI can assist with classifying feedback, summarizing comments, finding relevant knowledge, drafting follow-up, and supporting execution inside those controls. For customer experience measurement, that means a low score or negative signal can start governed work rather than disappearing into a dashboard.
The platform can also standardize the measurement definition itself. A governed document can specify the survey question, scale direction, formula, segment rules, data source, and reporting cadence. The connected workflow can then collect the evidence, route exceptions, and record the improvement decision so the score remains comparable over time.
Process Street also has direct, universal integrations to 5,000+ systems. Need a new one? An AI agent builds it on the fly. This allows feedback, support, CRM, analytics, and billing signals to trigger the right workflow while preserving ownership, approvals, and evidence.
The templates I have embedded throughout this post cover practical parts of the measurement loop. The following workflows support feedback, customer service, onboarding, and customer communication.
Asking Valuable Customers for Feedback Checklist
Use the Asking Customers for Feedback workflow
Customer Service Training Checklist
Use the Customer Service Training Checklist
High-Touch Customer Onboarding for SaaS Companies
Use the High-Touch Customer Onboarding workflow
Email Marketing Campaign Template
Use the Email Marketing Campaign Template
For a deeper guide to the outcomes behind these workflows, see customer success metrics. You can also create a Process Street account and adapt the workflows to your customer journey, measurement rules, and systems.
Customer experience measurement FAQs
How do you measure customer experience?
Measure customer experience by combining customer-perception metrics such as CSAT, NPS, and CES with journey context, operational measures, business outcomes, and qualitative feedback. Define the decision, segment, cadence, owner, and action before collecting data.
Which customer experience metrics should you use?
Use a balanced set. Pair a perception metric with an operational measure and a relevant outcome. For example, combine CES with resolution time and repeat contacts, or combine relationship NPS with adoption, retention, and interview themes.
How often should you review a CX scorecard?
Review operational measures daily or weekly when teams can act quickly. Review relationship and journey measures at a cadence appropriate to the lifecycle, often monthly, quarterly, or after a meaningful interaction. Avoid surveying customers more often than the decision requires.
Hopefully, this guide has shown you how to measure customer experience without reducing the customer relationship to one score. The strongest measurement programs connect evidence to an owner, an action, and a later review of whether the experience actually improved.